Circular Economy Metrics
Representation of the Circularity of Matter RightCircular©
The RightSupply Material Circularity Index (MCI) RightSupply summarizes the degree of recycling, recovery, and Recovery an organization’s products and operations throughout their entire life cycle. Developed by Ecomundis, theRightCircular© MCIprovides an annual calculation, expressing its magnitude as a percentage of corporate circularity from two distinct life-cycle perspectives (MCI-Local and MCI-Global), in a practical manner aligned with the Circular Transition Indicators proposed by the World Business Council for Sustainable Development (WBCSD) and the ISO 59020 standard.
-
LOCAL OR ORGANIZATIONAL ICML
INNER CIRCLE. This represents the level of circularity associated with the processes, products, and materials under the organization’s direct or indirect control. It takes into account the waste Recovery , and the maximum potential for recycling or reuse of the materials involved, incorporating the expected Recovery efficiencies based on the nature of the product supplied. -
ICMG GLOBAL OR SYSTEMIC
OUTER CIRCLE. It broadens the scope of analysis by incorporating the effective capacity of users or customers and the receiving system to collect, recover, and transform products and materials into new secondary materials at the end of their useful life. This index most closely approximates the MCI proposed by the Ellen MacArthur Foundation (LIFE 2015).
Circular Economy RS vs. 2026 2.1
-
CIRCULARITY SCALE
Represents the different levels of circularity achieved by an activity or organization in its MSI Index.L LOCAL.

RightCircular PROGRAM: Voluntary adhesion program for companies that wish to evaluate the circular economy index of their activity under technical and objective criteria following internationally recognized norms and standards. Tel. +34 93 7777 623 - validation@rightsupply.net

Representation of partial circularity indices RightCircularTM Inner circle: % of Partial Circularity Ci. Outer circle: Ci x System Circular Efficiency
INTENSITY OF THE ORGANIZATION'S MATERIAL
RightCircularTM is a tool that facilitates the calculation and recording of standardized circularity indicators proposed by ISO 59020 and ISO 59040 standards . It is aligned with the Global Circularity Protocol for Business of the WBCSD ( World Business Council for Sustainable Development) and its Circular Transition Indicators scheme .

Organization and activities
| Main families of products or services | |||
Cleaning services of all types of buildings - floor and pavement maintenance treatment services
| Production volumes per product/service family | |||
Cleaning services of all types of buildings - floor and pavement maintenance treatment services: 5235025,85 €
MAIN WEBSITE: https://www.pulim.net/
Social information
 |
 |
 |
Link here to our main social networks.
System boundaries define the processes, materials and flows that are included in the calculation, and their correct delimitation is vital to obtain a meaningful result. Clearly defined boundaries allow comparison of the MCI of similar products or organizations, since they are all evaluated under the same conditions. They also allow areas for improvement in circularity to be highlighted.
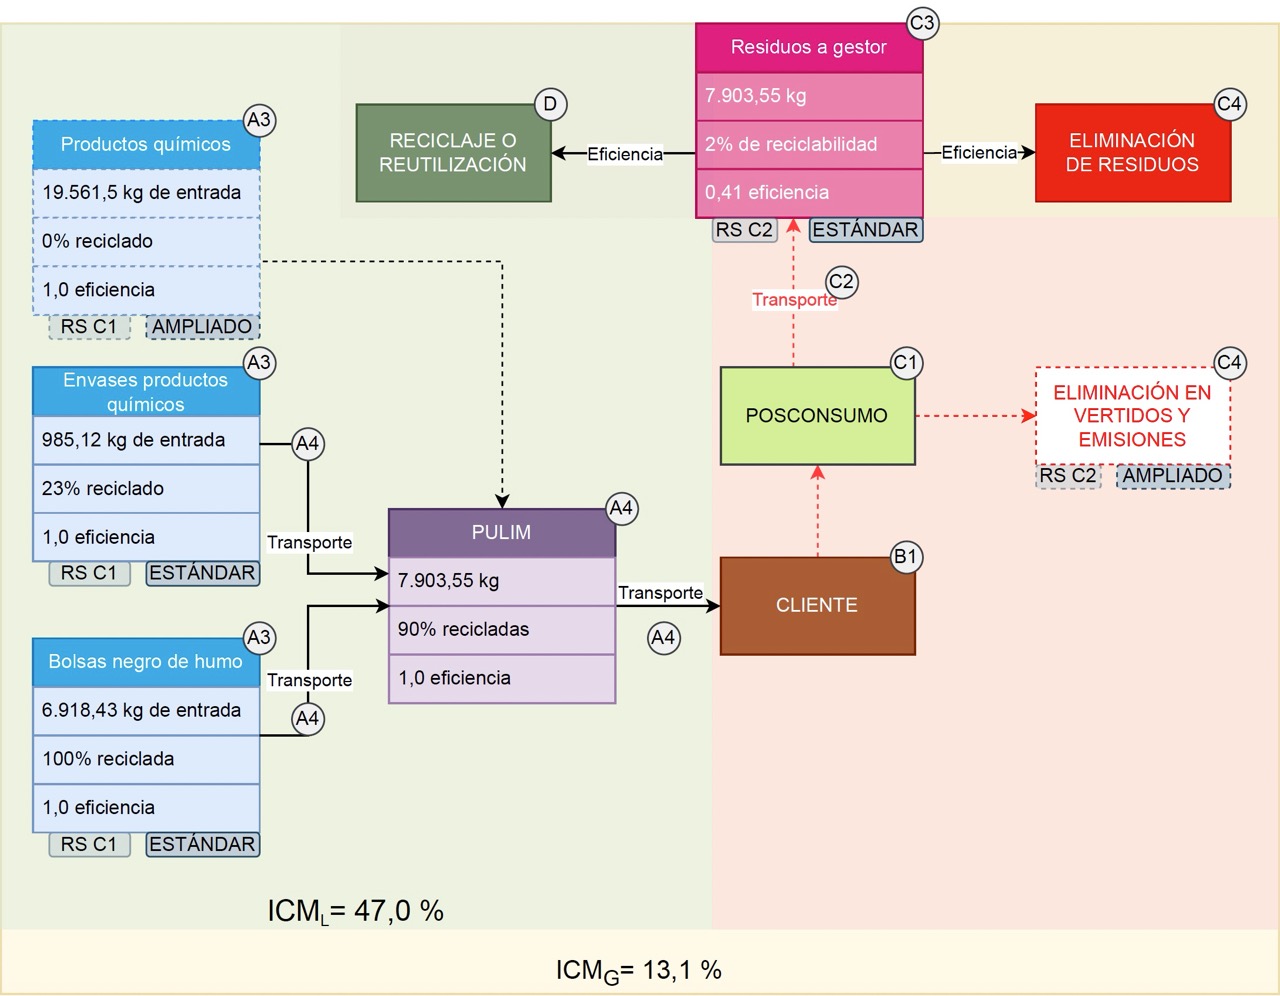
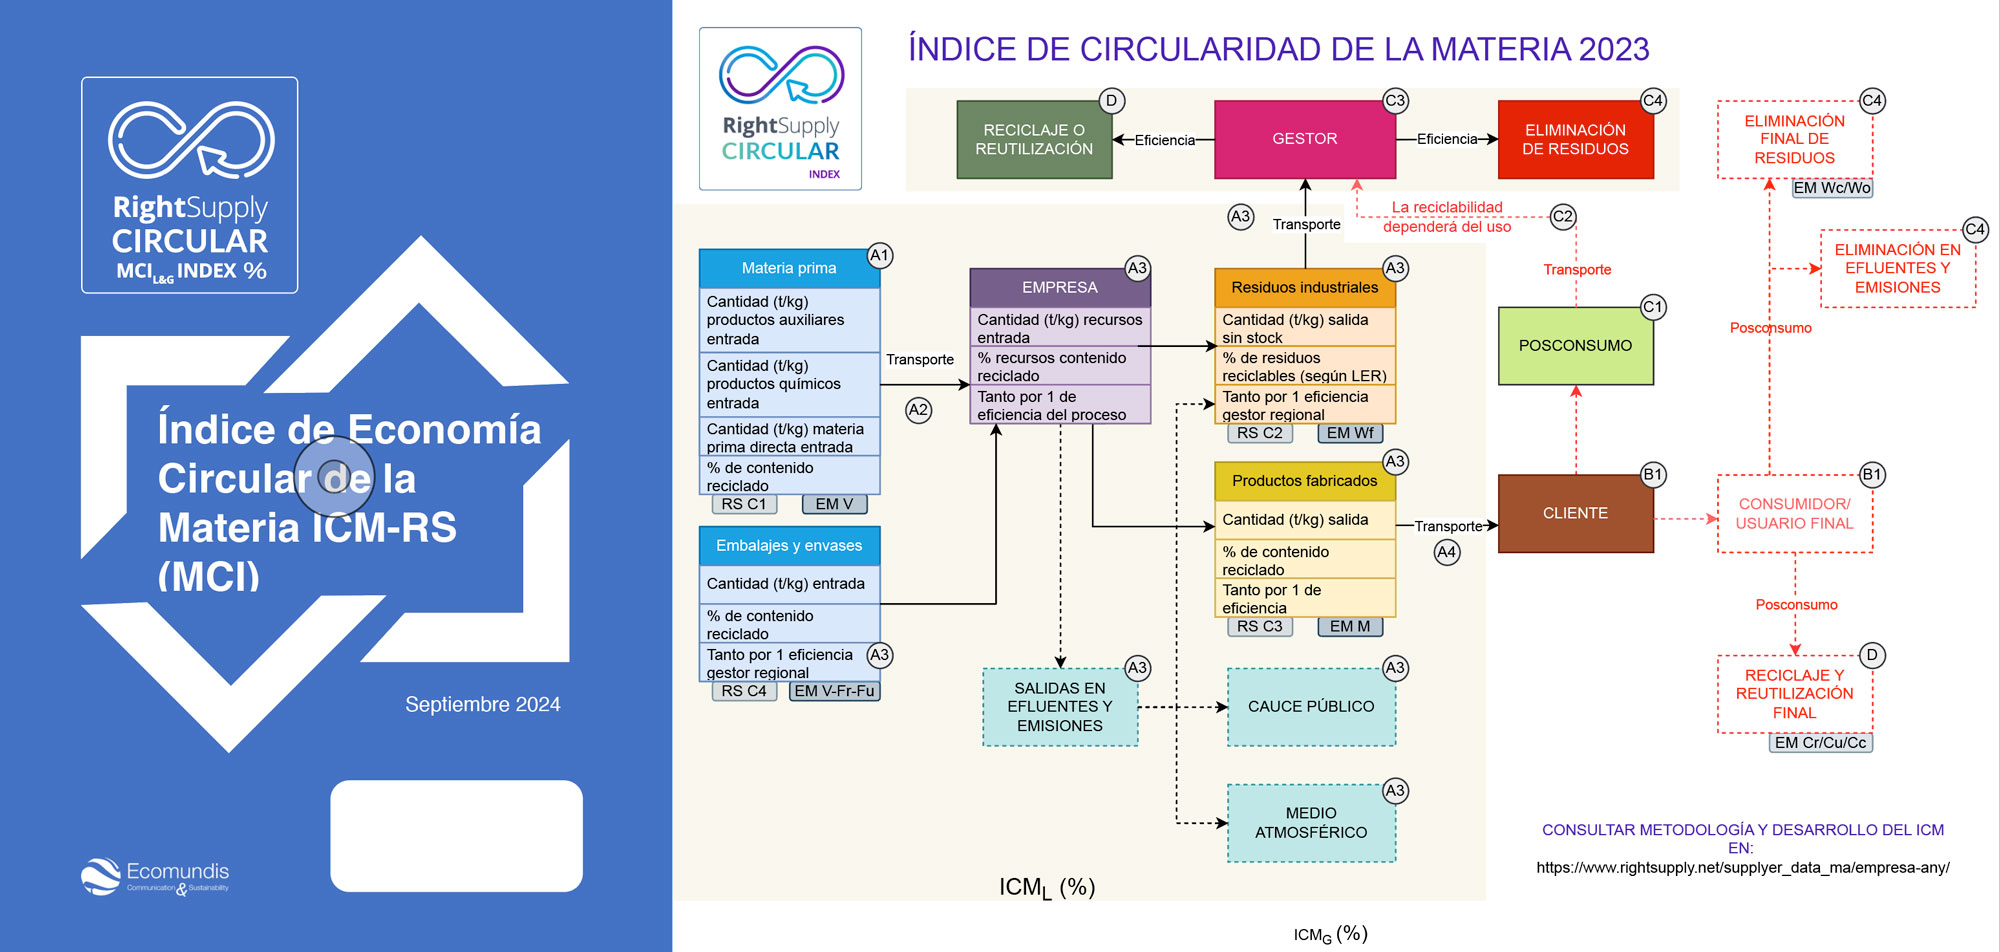
The following diagram shows the delimited system for the Pulim case, with the inputs, outputs and flows considered for the calculation of the LCI in green, and for the calculation of the GEMIin yellow. The different fields included in the diagram are assigned an LCA code. The codes included are as follows: A3: product manufacturing, A4: product transport, B1: product use (customer or final consumer), C1: collection and preparation for transport, C2: end-of-life product transport, C3: waste treatment, C4: waste disposal and D: potential for reuse, recycling and recovery.
The rest of the calculation components represented in the diagram can be consulted in the Methodology section of this report.
The circular economy is an economic model that seeks to maximize the value of resources through reuse, reduction and recycling, thus minimizing waste generation and environmental impact. The following are the main attributes of the circular economy of a general nature that our organization assumes in order to move towards a more circular economy:
- Design for the future: Products and services are designed to be durable, to use as few raw or auxiliary materials as possible, and to be reusable, repairable and ultimately recyclable or biodegradable.
- Preservation and extension of product life: Repair, remanufacturing and reconditioning are prioritized over replacement or disposal.
- Optimization of resource use: The aim is to use fewer resources and maximize efficiency in their use, opting for renewable sources whenever possible.
- Cycle closure: Instead of a traditional linear model of "extract, produce, consume, dispose", the aim is for resources to circulate in closed value loops.
- Minimal waste generation: By-products from one process are converted into inputs for another, reducing the need for virgin resources and minimizing waste.
- Service economy: Instead of selling products, services, such as renting or leasing, are offered to maintain ownership and responsibility over products and their life cycle.
- Return systems: Systems are implemented to recover and recycle products at the end of their useful life.
- Innovative business models: Businesses adopt models that generate value from reuse, remanufacturing, and recycling.
- Collaboration along the value chain: Producers, consumers, and recyclers work together to close resource loops.
- Integrated sustainability: Social, economic and environmental aspects are considered at all stages of a product's life cycle.
- Promotion of the local economy: The use of local resources is promoted and regional supply chains are strengthened.
The circular economy not only benefits the environment, but can also offer economic and social advantages, such as creating jobs, strengthening economic resilience and reducing dependence on scarce resources.
| ⏺ Environmental design and development of products and services |
 |
The products/services provided by PULIM, S.A. do not show any environmental improvement with respect to the competition. |
|
| ⏺ Design for the Circular Economy of processes |
| Ref. GRI Standard: 301 | ||
|
RAW MATERIALS. The raw or auxiliary materials acquired by PULIM, S.A. do not come from recycling processes. |
|
 |
PACKAGING. Part of the packaging used in PULIM, S.A. products comes from recycling processes. |
|
|
PACKAGING. Part of the waste generated by PULIM, S.A. packaging, after its use or destination, can be recovered. |
|
|
PACKAGINGS. The packaging used for the logistics and distribution of PULIM, S.A. products does not come from recycling processes. |
|
|
PACKAGINGS. Part of the waste generated by PULIM, S.A.'s packaging, after its use or destination, can be recovered. |
|
|
WASTE. The waste that may be generated by the products or services of PULIM, S.A. after use by the customer or consumer, can NOT be recovered (must be treated and disposed of in landfill). |
|
| ⏺ Life Cycle Analysis of products and services. |
|
PULIM, S.A. plans in the short term to carry out a life cycle analysis of its services by means of a recognized standard or benchmark with an expected date of 2024-2025. |
|
| References and validated impact categories | ||
| |
||
| ⏺ Emission recovery in processes |
|
Emissions generated by PULIM, S.A. processes are NOT recovered for other processes. |
|
| ⏺ Water recovery and use |
|
The wastewater generated in the processes of PULIM, S.A. is NOT recovered for other processes. |
|
| ⏺ Other Circular Economy improvements |
Actions aimed at the reduction of packaging 2025
We work for a reduction of up to 50% of the weight of the container. Approximately 50% of the workforce uses generic chemical cleaning products, using dilution systems of concentrated wall products. These products are also environmentally friendly products with the ECOLABEL LABEL. Other actions planned 2026-2027Implementation of the dosing of the most generic AND MOST FREQUENTLY USED chemicals to the remaining 50% of the workforce. This would imply these impacts :
|
||
| RSs: 15 | ||




















ICM Circularity Index - RightSupply IEC-RS
RightSupply's Circularity of Matter Index IEC-RSwas developed in 2020 from the Material Circularity Indicator (MCI ) introduced by the Ellen MacArthur Foundation (MCI), in response to the need to initiate the progressive collection of information and data necessary for its technical calculation in the products of organizations.
The platform RightSupply platform incorporates a tool designed to help companies assess how circular their products, services and operations are in relation to resource management. The objective is to quantify circularity and provide a clear and objective measure to identify areas for improvement.
RightSupply s ICM takes into account several factors, such as:
- The origin of the materials and their packaging: whether they are of virgin or recycled origin.
- The generation of wastes and residues: If they are recovered or recycled again for other processes.
- Product utilization: How long and how efficiently a product is used before the end of its useful life.
- The final destination of the product: whether it is recycled, reused or discarded.
The ICM index - IEC-RSis calculated on a percentage scale, where 100% indicates a mostly circular product and 0% a fully linear one. Thus, companies can use the MCI to evaluate and compare products, make informed design and production decisions, and chart a roadmap towards greater circularity. Unlike the indicator proposed by the HM. RightSupply the IEC-RS uses percentage rather than unit values for a better understanding of the index.
Calculation parameters
RECYCLING AND MATERIAL RECOVERY FACTORS
-
- VIRGIN MATTER [V= Vp+ Ve] [V] [V]
- REUSED AND RECOVERED MATERIALS (RR) [Fr and Fu].
- RS MATERIALS C1. % of RR materials in materials purchased or acquired. [RS C1= Vp - (Fr+Fu)] (%)
- WASTE C2. Percentage of RR materials in waste generated in manufacturing processes or services rendered. E2. Efficiency factor (0 to 1) in the processes of waste managers/ RR valorizers C2.
- OWN PRODUCTS C3. Percentage of potentially Recyclable or Recoverable materials in final products delivered to B2B customers or end consumers. B2C (excluding packaging). E3. Efficiency factor (0 to 1) of the RR C3 process expected in the target region for the final product (it is recommended to take an average value). [RS C3= M - Wf + Wc + W0] (%). EfficiencyEC3= 0.9
- PACKAGING C4. The percentage weight fraction of potentially Recyclable or Recoverable packaging delivered to the B2B customer or B2C end consumer. E4. Efficiency factor (0 to 1) of the RR C4 process (it is recommended to take an average value). [RS C4= Ve - (Fr+Fu)] (%)
- END-OF-LIFE. It incorporates efficiencies at the post-consumer product level. Ellen MacArthur incorporates the components: Post-consumer disposal [Wc + W0] and post-consumer recycling/reuse [Cr + Cu + C0].
LIFE CYCLE APPROACH
NOTES FOR THE CALCULATION OF VARIOUS PRODUCTS
- C1 is a value obtained for the organization as a whole. It comes from the evaluation of raw materials and goods purchased by the organization.
- C2 is a value obtained for the organisation as a whole. It comes from the data provided by the waste managers.
- C3 and C4 are calculated based on the weighting of the circularity values of each product according to its mass ratio (mi) with respect to the total product marketed by the organisation (Mt). Where m/i is the mass of each product and Mt is the total mass. Example (Product i: A,B,...)
C3=(C3A * mA+ C3B *mB)/Mt C4=(C4A * mA + C4B *mB)/Mt
In the case of calculating the Circular Economy Index for several products, the product utility and longevity factors should be applied product by product before averaging the Ci contributions, as different products may have different values of these factors. USEFULNESS AND LONGEVITY OF PRODUCTS FACTORS
- Uf: functional units used for each unit of marketed product.
- Uf.s.: industry average functional units for an expected life of the product.
- L: Expected longevity of the marketed product.
- L.s: Longevity or average useful life of the sector, expected for the product.
The RightSupply IEC-RS Circularity of Matter Index contemplates two values that from a meric understanding point of view should be differentiated:
Local or own ICML (ACV - Cradle to Gate):
An organization's own circularity index that takes into account the maximum potential for Recovery recycling/reuse of the materials contained in its products. It incorporates the Recovery efficiencies based on the type of product supplied.
ICMG Global (LCA - Cradle to Grave):
An organization’s overall circularity index that takes into account Recovery the recycling/reuse of materials throughout the entire life cycle. This index is the closest approximation to the one proposed by the Ellen MacArthur Foundation and is recommended for organizations that control the entire product value chain, from the source of raw materials to the final product purchased by the end consumer.
REFERENCES: The IEC-RS Index is a revision carried out in 2020 by Ecomundis - Right Supply, based on the 2015 MCI Index proposed by the Ellen MacArthur Foundation in the framework of the European Union's LIFE+ project.
Assumptions and limitations
The model has been built on the following assumptions, many of which have been discussed more fully elsewhere in this paper: 1. more fully discussed elsewhere in this paper:
- The indicator does not explicitly favor closed loops. That is, for example, that material recovered for recycling does not have to be returned to the original manufacturer.
- It is assumed that the material recovered at the end of its use can be processed to a quality similar to that of the original virgin material.
- It is assumed that there is no loss of material in the preparation of the products collected for reuse.
- It is assumed that the mass of the product does not change from its manufacture to the end of its use. Specifically, this means that no part of the product is "consumed" (e.g., burned or dematerialized) during use.
Circular Economy RS vs. 2026 2.1
