








Environmental Statement
EMAS STATEMENT REPORTING PLATFORM

Environmental Statement
EMAS EUROPEAN REGULATIONS

Environmental Statement
EMAS STATEMENT REPORTING PLATFORM
GRUPO CEMENTOS PORTLAND VALDERRIVAS:
OLAZAGUTÍA FACTORY
Annex IV.B Environmental statement
- A summary of the organisation's activities, products and services, the organisation's relationship to central organisations, if applicable, and a clear and unambiguous description of the scope of the EMAS registration, including a list of the sites included in this registration;
 |
General data |
Introductory Presentation
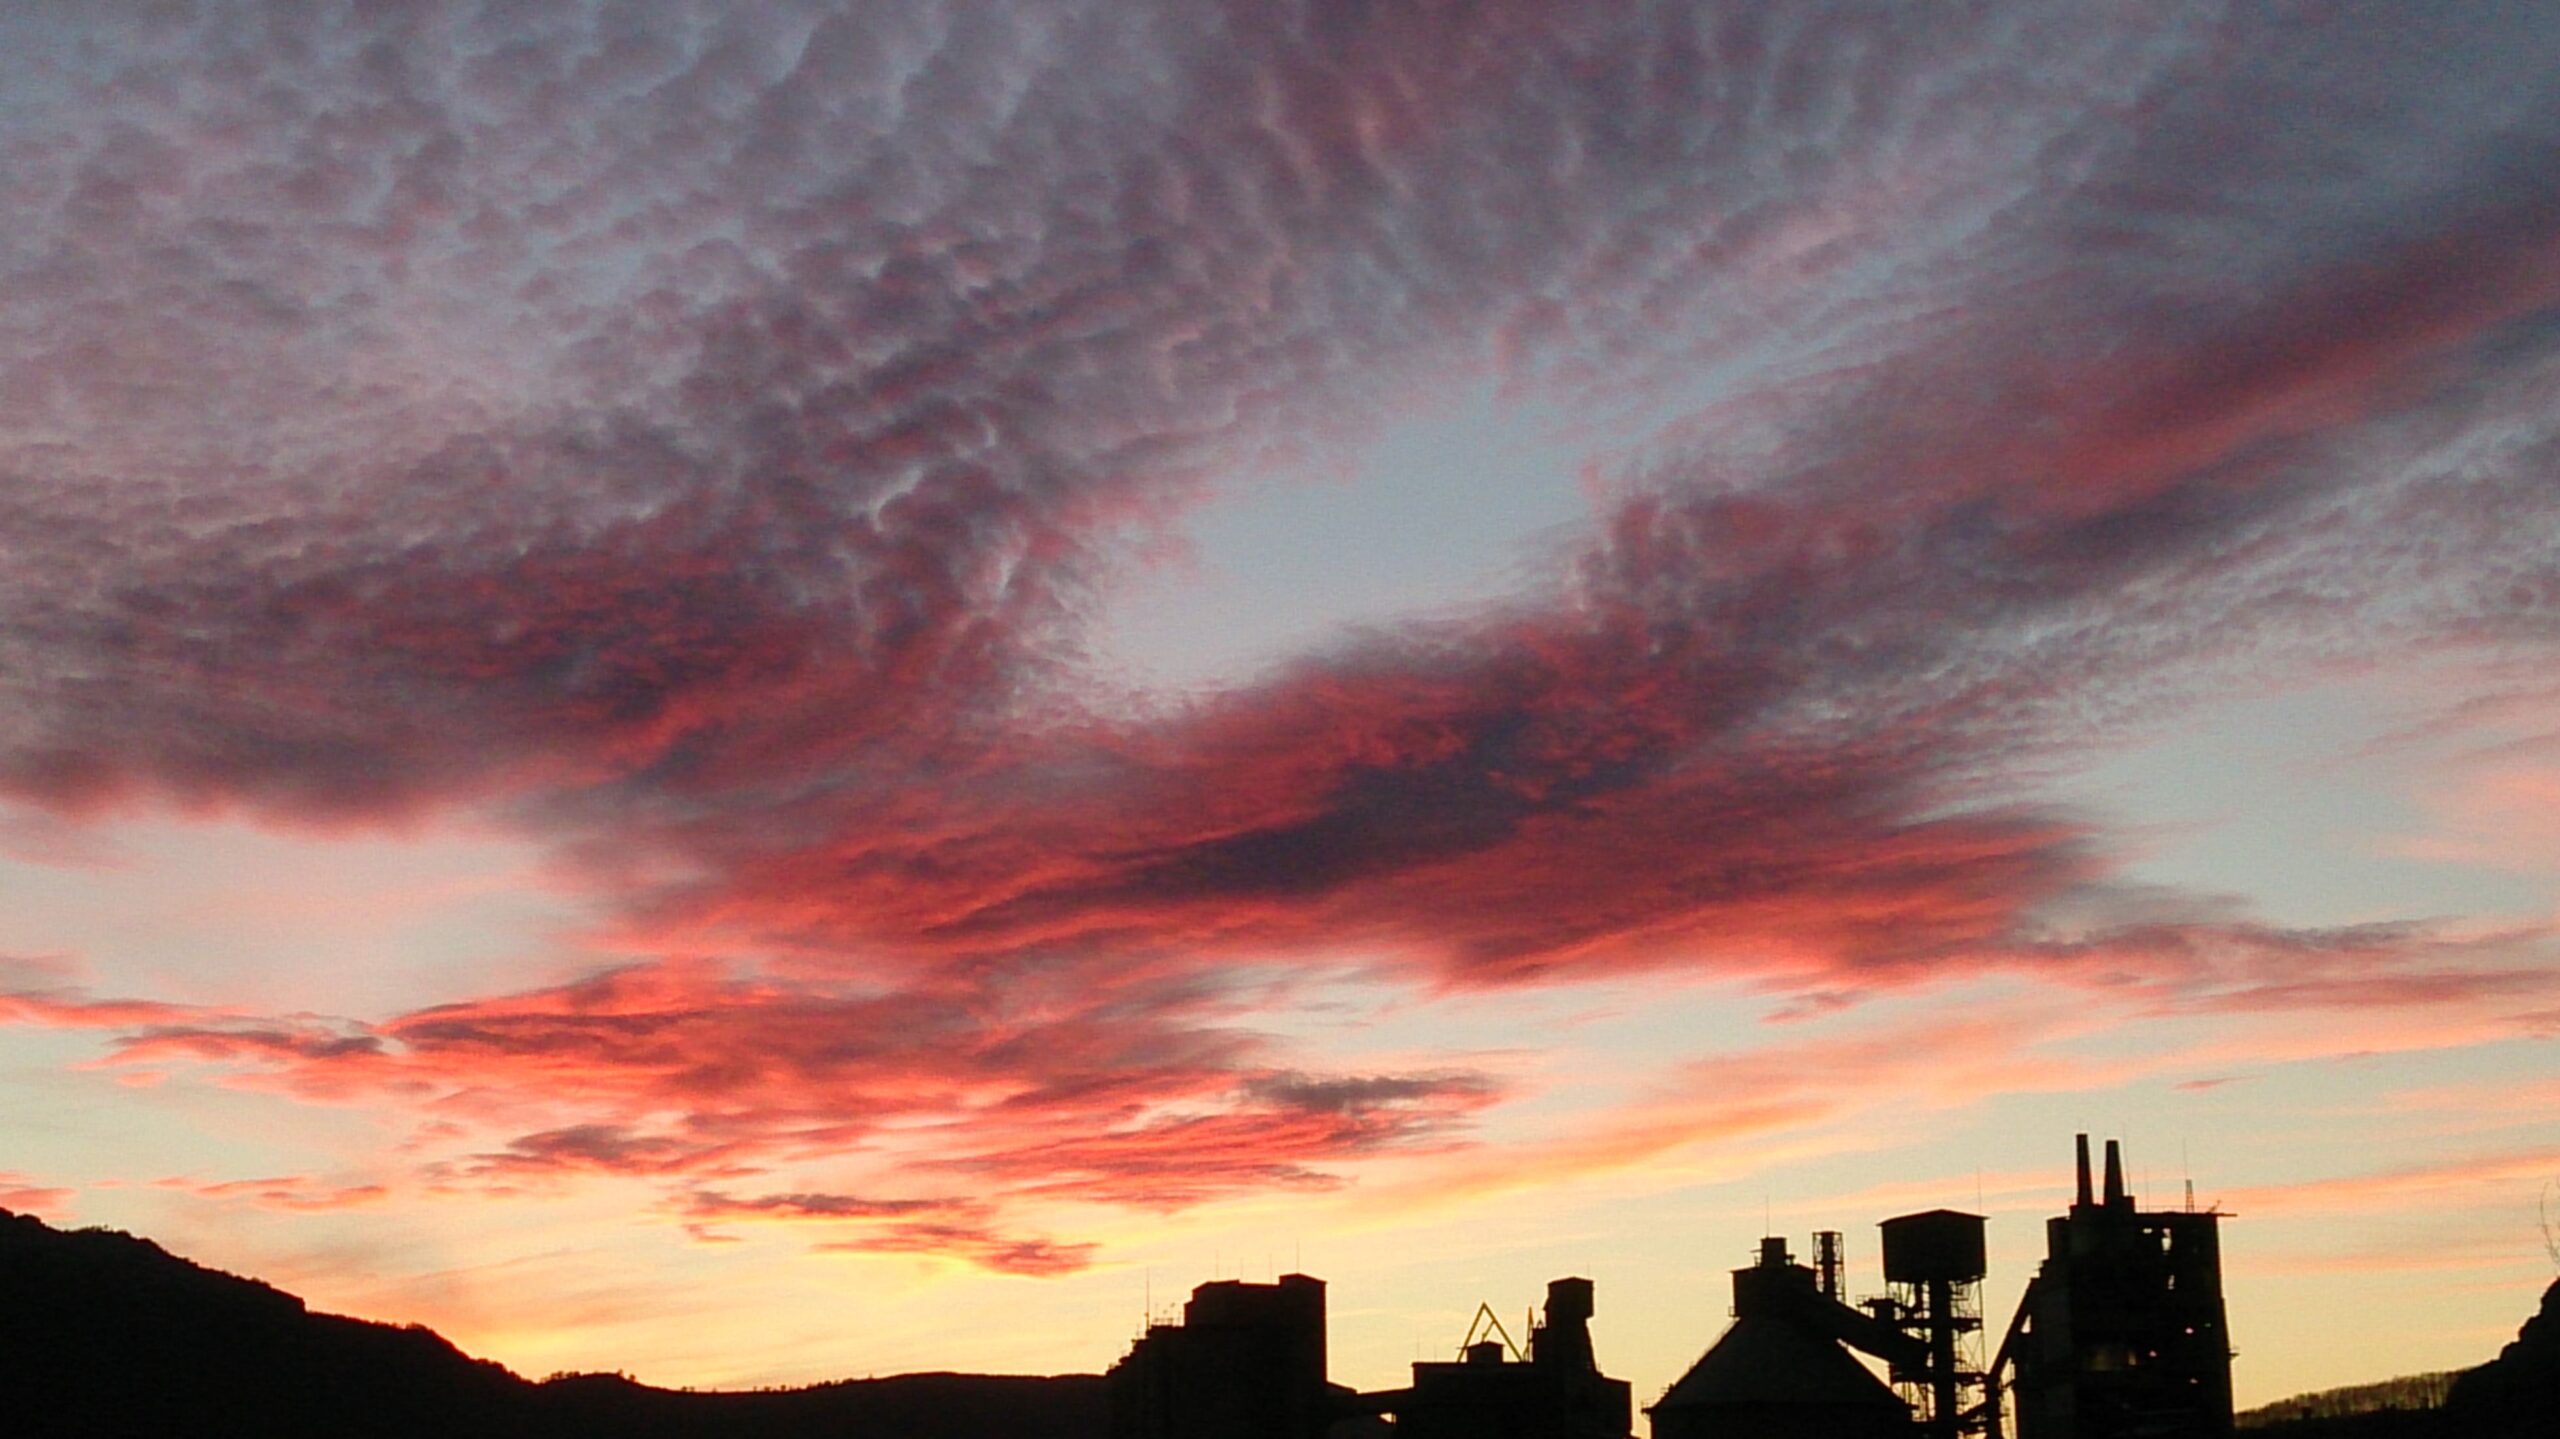
This link contains our Environmental Statement for the Olazagutía Plant, which belongs to Grupo Cementos Portland Valderrivas, in accordance with EMAS regulations. It is the first statement we have published in a 100% online and digital format. The aim is to provide our stakeholders with all the necessary information about those aspects and activities relevant to the environment associated with its limestone quarrying and clinker, cement, and mortar production activities.
The Grupo Cementos Portland Valderrivas operates in the cement business based on a commitment to Sustainable Development, with an Environmental and Energy Management System (based on ISO 14001:2015 and ISO 50001:2018 standards) that takes into account the context of the factory with thinking based on risk and opportunity management, applying a life cycle approach to the products manufactured that contemplates:
- Planning of actions to control risks associated with environmental aspects and context analysis.
- Compliance with applicable requirements and performance evaluation
- Environmental improvement plans
- Action planning for the control of stakeholders' needs and expectations.
This Statement provides an update on the performance results of quantitative indicators related to environmental management aspects for 2024: consumption of raw materials, fuels, electricity, and water; Recovery ; emissions to air, soil, and water; biodiversity initiatives; and environmental emergencies.
Indicators and results are prioritized, summarizing the environmental evolution with respect to previous Declarations in order to demonstrate improvements. All the contents of the Environmental Statement have been reviewed by the Management, with independent validation by AENOR (the certificate can be seen at the end of the document).
Agenda 2030. Related Sustainable Development Goals
This Environmental Statement includes at the end a specific section with information on the 2030 Agenda.






 |
2025 |
From January 1 to December 31.
 Centre/s
2
 Workers
128
 Surface area
900,919 m²
 Activity in
480,744 metric tons of manufactured product (cement produced + clinker sold)
Total production: 480,744 metric tons.
Our organisation presents this validated Environmental Statement as part of our commitment to transparency and environmental improvement of our activities, operations and facilities.
LOCATION- MAIN CENTER
|
Description of the activity |
Activities and scope of the Environmental Statement
Cementos Portland Valderrivas is the industrial cement group to which the Olazagutía factory belongs.The company is part of an industrial group with a strong mining component that is involved in the entire construction business cycle. It consists of several companies based in Spain, with seven cement factories spread across the country and in Tunisia. Its environmental organization is based on a functional hierarchical relationship between the Corporate Areas and the Areas of Operational and Business Responsibility. The Olazagutía Factory originated from the company Cementos Portland S.A., which decided to set up the cement factory in 1903, until July 1993 when it became part of the Portand Group due to the merger by absorption of this company with Cementos El Alto S.A. Its activity is registered under NACE code 2351 for cement production activities and NACE 0811 for marl extraction. The Olazagutía factory, covering an area of 118,819 m², is located in the Autonomous Community of Navarre and is dedicated to the production of clinker and gray cement using two dry-process kilns. Its facilities are located in the municipality of Olazagutía and are surrounded by the A-1 highway and the right bank of the Burunda River, except for the marl storage yard. Plant location: Barrio de la Estación, 37. 31809 Olazagutía, Navarre.


Our organisation presents this validated Environmental Statement as part of our commitment to transparency and environmental improvement of our activities, operations and facilities.
|
Environmental management and governance approach |
Description of the Environmental Management System
In order to ensure compliance with business objectives, the Grupo Cementos Portland Valderrivas, and therefore its factories in Spain, have established as a tool the Environmental and Energy Management System, adapted to the characteristics, particularities and needs of the organization and facilities and inspired by the concepts that define continuous improvement. The management system implemented complies with the international standard UNE-EN-ISO 14001, adopted in 2017, and with European Regulation 1221/2009 (EMAS III), amended by Regulation 1505/2017 and Regulation 2026/2018 – the latter registered in 2008 with the code ES-NA-000010. This management system, the audits and reviews carried out by the Management, allow us to maintain a dynamic environmental management system, always based on the following basic principles: Inspired by the philosophy of continuous improvement, it will be subject to the P-E-V-O cycle (Plan - Execute - Verify - Optimize), and is supported by documents such as the Manual and General Procedures that respond to its interaction with the Corporate Departments and common between factories; as well as specific ones that collect the particular operation and adapted to the legal requirements of each facility. The organizational context of the Olazagutía factory is determined by internal and external issuesthat influence the ability to achieve the objectives of the Environmental Management System. External factors are mainly grouped into: the needs and expectations of external stakeholders, geographical location, commercial situation, economic situation, legal and other applicable requirements, and others. Internal factors include internal stakeholders, aspects of the business group, environmental aspects, the production process itself, technological changes, management practices, and others. The analysis of risks and opportunities is carried out through the evaluation of qualitative or quantitative criteria. In the case of risks associated with environmental aspects and legal requirements, quantitative criteria are preferably used, as far as possible. The identification of risks and opportunities is carried out after the evaluation of environmental aspects, verification of applicable legal requirements and definition of the context and expectations and needs of interested parties. When qualitative criteria are used, we try to ensure that they are consistent and homogeneous based on experience and knowledge of the particular context of each plant. Thanks to the combination of probability and severity of the impact, their prioritization and the type of preventive action to be taken are established.
Organizational context
Determination of risks and opportunities
Location and contact
Address: Cementos Portland Valderrivas, Barrio de la Estación, 37. 31809 Olazagutía, Navarra – Tel: 948 466 100 – Email: agustin.sandoval@gcpv.com
Web: www.valderrivas.es
.
Main and secondary CNAE Code: 23.51, 08.11
|
Environmental policy |
Organizational Policy
Grupo Cementos Portland Valderrivas Environmental and Energy Policy, approved in July 2022 by the Director of Operations and revised in May 2025, is aligned with the UNE-EN ISO 14001:2015 and UNE-EN ISO 50001:2018 standards. It reflects the Group’s commitment to environmental protection and pollution prevention, taking into account the context of its activities. Its principles include: providing resources to meet environmental objectives and regulatory requirements, exceeding the legal minimum; promoting continuous improvement in facilities and environmental aspects using a life-cycle approach; establishing plans with resources for the energy transition and decarbonization, aligned with sectoral, national, and international strategies; and integrating environmental and energy criteria into strategic planning, investments, and equipment procurement. Business success is linked to these sustainable practices.
- Resourcing
- Continuous improvement
- Energy transition and decarbonization
- Inclusion of environmental and energy considerations in strategic planning.
- Employee training and awareness
- Communication and outreach with stakeholders
- Energy efficiency
- Risk and opportunity management
- Fight against climate change
- Circular economy
- Water management
- Waste minimization
- Conservation of the environment
POLICY: Environmental and Energy Policy, May 2025-fa3828b9
Mission
To develop, produce and market cement and construction materials, contributing to sustainable development, with special attention to safety and the environment, satisfying our shareholders, staff, customers and suppliers.
.
Vision
 |
Communication and participation |
Communication and stakeholder engagement
As with any business project, stakeholder participation in business development is an essential element of the Olazagutía factory's strategy. We therefore strive to communicate our activities clearly and transparently in order to raise awareness and improve our reputation.
Internal communication
Internal communication has been discussed at the various meetings of the factory's Environmental Committee. The Environmental Delegates are informed of the development of the Environmental Surveillance Plan campaigns and environmental incidents. For the preparation of the environmental statement, the opinion of the workers' representatives is taken into account through the meetings of the Environmental Committee and in the communication actions carried out.
Throughout 2025, the information system on environmental management at the plant—including the results of monitoring campaigns, waste management, Recovery other relevant environmental aspects—continues to be maintained. Initiatives related to the Olazagutía plant are published in the magazine *Portland Contigo*.
Shareholders
The channels that ensure communication and dialogue between the Group and its shareholders are as follows:
- The General Shareholders' Meeting.
- Specific call center service
- The specific email address: rgi@gcpv.es
- The corporate website in its section aimed exclusively at shareholders and investors
Employees
The satisfaction and motivation of the Group's human team is one of our greatest challenges.
We have developed different internal communication channels that provide our employees with continuous information on our activities while encouraging their participation and involvement in decision-making related to environmental issues:
- Suggestion boxes: allow direct communication of their environmental points of view, improvement, request for information, etc. and to which there is an obligation to respond by the company within a set period of time.
- Environmental Committees: These are regular meetings between Management and Department Heads and meetings with Operations Management to discuss common issues and establish strategies for action. Union delegates are invited to the factory committees.
- Training sessions: established in accordance with the Annual Training Plan, it is a bidirectional tool through which we transmit aspects related to the environment.
- Works Councils and Health and Safety Committees: channels through which employees can share their opinions and suggestions on issues such Recovery and improvements in risk prevention and environmental protection. Relevant information—whether arising from these committees or initiated by the Company and employees—is disseminated through meeting minutes and the bulletin board.
- Internet portal: in accordance with current legislation, the Group provides society with a corporate website www.valderrivas.es to comply with the requirements of the Transparency Law and the disclosure of environmental information.
The dissemination of relevant information on environmental matters, arising from environmental committees or promoted by the Company and employees, is done through personalized letters and the bulletin board.
External communication
Suppliers, auxiliary industry and customers
It is our intention to advance in the commitment to extend our Environmental and Energy Policy to suppliers and contractors, making them participants in our environmental practices in order to work in an environmentally friendly way. In this sense, we provide them with instructions for action and ask our suppliers for information regarding their management, aware that the ultimate satisfaction of our customers' needs depends on the quality of the entire supply chain.
Our company focuses its efforts on offering competitive, high-quality products through our Quality Management System, which complies with UNE-EN-ISO 9001 and ensures consistency in our main commitment to our customers, developed within a framework of respect for the environment. The communication channels established to meet the environmental information needs of these stakeholders are the Commercial Assistance Department and our Group's website through the Customer Channel.
Public and private administrations
The Olazagutía factory collaborates with public and private institutions whenever possible in promoting initiatives or projects of interest to the community.
Regional administration. Formal communications are maintained on an ongoing basis with the regional administration. During the year, various technical meetings were held to discuss existing authorizations, as well as future ones within the framework of sustainability.
Local government. Various contacts have been maintained with the local government.
Associations and business groups
From the factory, through the Group's representatives, we are in contact with other associations and business groups in Spain and Europe. In this sense, our achievements have been disseminated for application to other companies in the sector through our presence in OFICEMEN, the Spanish Cement Manufacturers Group, in IECA (Spanish Institute of Cement and its Applications) and in CEMBUREAU, the European Cement Manufacturers Association, forums in which we present our process improvements and our management model.
Society in general
An essential element of our cultural tradition is our company's deep roots in the territories where we operate. For this reason, we have developed a broader vision in our relationship with social agents and community stakeholders, improving channels of communication, dialogue, and collaboration. We are strengthening ties with social organizations—neighborhood associations, environmentalists, universities, unions, among others—through a wide variety of actions. We would also like to highlight various communications in regional print media, with the aim of reaching the closest stakeholders and offering first-hand information.
Sustainability Reports
In accordance with the Global Reporting (GRI) Sustainability Reporting Guidelines, they provide a balanced and reasonable presentation of the company's economic, environmental, and social performance.
Social information
Link here to our main social networks.
 |
 |
 |
 |
Environmental assessment and performance |
|
Key metrics |
◉ Global indicators 2025
Includes the sum of all the organisation's sites under the EMAS Register.
ENERGY CONSUMPTION

404,352.5MWh
• Renewable energy consumption : 68.1%
• Renewable generation:0%
WATER CONSUMPTION

28,130m³
• Grid supply14.49%
Source: Grid
TOTAL DISCHARGES

786,837m³
•100% public waterway
CO2 EMISSIONS

286,155 (ETS)metric tons
• Indirect: 1.71%
• Direct: 98.29%
WASTE

596.21metric tons
• Hazardous 5.12%
• Recovery 97.93%
Unit values on production/performance
0.841 MWh/480,744 metric tons of manufactured product (cement produced + clinker sold)
0.058 m³/480,744 t Manufactured product (cement produced + clinker sold)
1.64 m³/480,744 t Manufactured product (cement produced + clinker sold)
0.59 Tn/480,744 t Manufactured product (cement produced + clinker sold)
0.00122 Tn/480,744 t Manufactured product (cement produced + clinker sold)
|
Dimension of the activity |
Description of the main activity
The production process begins with the extraction, by blasting, crushing, and storage, of limestone raw materials from a quarry, with a concession area of 39 grid squares or 10,092,000 m². The most significant environmental impacts associated with quarrying are: visual impact, changes to the morphology of the land, occupation of natural spaces, depletion of natural resources, and impacts associated with mining, such as vibrations, noise, and particle emissions, mainly. Next, this previously homogenized limestone, together with other raw materials, is ground and mixed to produce raw meal. This raw meal is heated to over 1,450°C using previously ground and conditioned petroleum coke as the main fuel in a horizontal rotary kiln through a cyclone tower, producing the intermediate product clinker, which consists mainly of calcium silicates, responsible for the irreversible hardening of cement in contact with water and/or air. The most significant environmental impacts associated with cement manufacturing are: air pollution from grinding and combustion processes, global warming, noise emissions, and the depletion of natural resources associated with fossil fuels and energy. Its grinding, together with other additives and a setting regulator, such as gypsum in appropriate proportions, results in cement with specific and standardized chemical, physical, and mechanical properties depending on the type of additive (from limestone to fly ash or blast furnace slag, among others) and the fineness of grinding. The final product is stored in silos for bulk sale or subsequent bagging.

Evolution of production activity
Business performance
Activity by type
Type of productive activity
| HOLDING | COMPANY | SITE | STATUS | wdt_ID | userid | YEAR | rp | SCOPE | CENTER | MAGNITUDE | UNIT | ACTIVITY | %RECYCLED | % Hazardous | SALES (€) | DESTINATION COUNTRY | REF. REPORT | REMARKS | link route | post_author | post_type |
|---|---|---|---|---|---|---|---|---|---|---|---|---|---|---|---|---|---|---|---|---|---|
| GCPV | CEMENTOS PORTLAND VALDERRIVAS, SA | OLAZAGUTIA | VALIDATED | 298 | 2.090 | 2023 | PRODUCTION | Quarry | 399.456,00 | t | Extraction and production of MARGA | Spain | EMAS | 2.090 | emas_statement | ||||||
| GCPV | CEMENTOS PORTLAND VALDERRIVAS, SA | OLAZAGUTIA | VALIDATED | 299 | 2.090 | 2024 | PRODUCTION | Quarry | 439.370,00 | t | Extraction and production of MARGA | Spain | EMAS | 2.090 | emas_statement | ||||||
| GCPV | CEMENTOS PORTLAND VALDERRIVAS, SA | OLAZAGUTIA | VALIDATED | 301 | 2.090 | 2023 | PRODUCTION | Factory | 303.245,00 | t | Production of GREY CLINKER | Spain | EMAS | 2.090 | emas_statement | ||||||
| GCPV | CEMENTOS PORTLAND VALDERRIVAS, SA | OLAZAGUTIA | VALIDATED | 302 | 2.090 | 2024 | PRODUCTION | Factory | 304.012,00 | t | Production of GREY CLINKER | Spain | EMAS | 2.090 | emas_statement | ||||||
| GCPV | CEMENTOS PORTLAND VALDERRIVAS, SA | OLAZAGUTIA | VALIDATED | 304 | 2.090 | 2023 | PRODUCTION | Factory | 397.511,00 | t | Production of GRAY CEMENT (Manufactured product) | Spain | EMAS | 2.090 | emas_statement | ||||||
| GCPV | CEMENTOS PORTLAND VALDERRIVAS, SA | OLAZAGUTIA | VALIDATED | 305 | 2.090 | 2024 | PRODUCTION | Factory | 436.485,00 | t | Production of GRAY CEMENT (Manufactured product) | Spain | EMAS | 2.090 | emas_statement | ||||||
| GCPV | CEMENTOS PORTLAND VALDERRIVAS, SA | OLAZAGUTIA | VALIDATED | 493 | 2.090 | 2025 | PRODUCTION | Quarry | 488.041,00 | t | Extraction and production of MARGA | Spain | EMAS | 2.090 | emas_statement | ||||||
| GCPV | CEMENTOS PORTLAND VALDERRIVAS, SA | OLAZAGUTIA | VALIDATED | 494 | 2.090 | 2025 | PRODUCTION | Factory | 330.927,00 | t | Production of GREY CLINKER | Spain | EMAS | 2.090 | emas_statement | ||||||
| GCPV | CEMENTOS PORTLAND VALDERRIVAS, SA | OLAZAGUTIA | VALIDATED | 495 | 2.090 | 2025 | PRODUCTION | Factory | 480.744,00 | t | Production of GRAY CEMENT (Manufactured product) | Spain | EMAS | 2.090 | emas_statement | ||||||
Evolution of production activity
The wide range of products manufactured allows for the ideal selection based on the application. The cements marketed in 2025 from the Olazagutía plant include three types, all of which are certified with AENOR’s “N” Product Certification mark and bear the CE marking, complying with current legislation and the requirements of the UNE-EN 197-1 and UNE 80305 standards.
CEMENT COMPANIES WITH THE HIGHEST MARKET SHARE IN 2025
|
PRODUCT |
Regulations |
MARKET |
% PRODUCTION |
|
CEM II/A-L 42.5 R |
UNE-EN 197-1 |
Interior |
63 |
|
CEM I/52.5R (ai) Esp |
UNE-EN 197-1 |
Interior |
12 |
|
CEM II/A-M (V-L) 42.5 R |
UNE-EN 197-1 |
Interior |
9 |
It is worth noting the production capacity at its facilities for other specialty cements, which were marketed in 2025 as CEM I 52.5 R (ai), CEM I 52.5 R (ba), and Ultraval. Production in 2025 totaled 330,927 metric tons of clinker, 480,744 metric tons of cement, and 488,041 metric tons of marl from the quarry; clinker and cement production increased by about 10% compared to 2024. Our cements have a Safety Data Sheet that allows customers a safe and responsible use of the product, due to its irritant character associated to its alkalinity, mainly.
 |
Energy use and management |
Energy management
The processes involved in cement manufacturing—which include the calcination and grinding of raw materials, fuels, and clinker—require a high level of energy consumption. This energy comes primarily from fuels, thermal energy, and electricity. For this reason, some of the improvement initiatives undertaken are aimed at optimizing energy consumption.
Environmental management and control
Fossil fuel consumption
The fuels commonly used in cement factories in Spain are petroleum derivatives, such as petroleum coke, fuel oil, and heating and vehicle diesel. The use of fossil fuels per ton of clinker is shown graphically, revealing a decrease compared to previous years.
We can see that energy consumption from various fossil fuels is increasing significantly on a global scale, but when measured per metric ton of product manufactured, consumption per metric ton of manufactured product is decreasing.
Electricity consumption
Electricity is mainly used in the process for crushing quarried materials and grinding raw materials, fuels, and clinker, with the latter accounting for the highest percentage of electricity consumption.
Electricity consumption has increased very slightly in absolute terms and has fallen significantly in relative terms for the factory, remaining stable for the quarry.
Evolution of specific metrics and ratios
Units of energy consumption in MWh and their ratios associated with the activity.
Energy consumption by fuel
Uses of energy
The energy magnitudes are always parameterized in MWh, showing in each cell its transformation to GJ, by means of the standard MWh*3.6 conversion (factor officially recognized and used by the SI (BIPM), Eurostat, IEA, IPCC and in Spain by MITECO).
| wdt_ID | userid | Year | Center | Units Pr. | Unit | Uses / Info | Electricity Consumption (MWh) | LNG/LPG consumption (MWh) | Oil / Coal (MWh) | Other Consumption (MWh) | gasnatural_gl | tankers_gl | other_gl | ind_gasnatural_gl | ind_petroliferos_gl | ind_other_gl | post_type | post_author | Electricity Ratio (Units Pr. | GN RatioPr.Units Pr. | Gasoline Ratio (Units Pr. | Ratio of other MWh toUnits Pr. | Total consumption ratio (Units Pr. | Total consumption (MWh) | Ratio of Total GJ/ Udp | Total GJ | Electrical in GJ | Electric GJ/udp Ratio |
|---|---|---|---|---|---|---|---|---|---|---|---|---|---|---|---|---|---|---|---|---|---|---|---|---|---|---|---|---|
| 307 | 2.090 | 2023 | Factory | 303.245,000 | t Clinker fabricated | Production—Fossil fuels | 0,000 | 0,000 | 334.769,722 | 0,000 | 0,000 | 1.205.170,999 | 0,000 | 0,000 | 3,974 | 0,000 | emas_statement | 2.090 | 0,000 | 0,000 | 1,104 | 0,000 | 1,104 | 334.769,722 | 3,974 | 1.205.170,999 | 0,000 | 0,000 |
| 308 | 2.090 | 2024 | Factory | 304.012,000 | t Clinker fabricated | Production—Fossil fuels | 0,000 | 0,000 | 327.427,222 | 0,000 | 0,000 | 1.178.737,999 | 0,000 | 0,000 | 3,877 | 0,000 | emas_statement | 2.090 | 0,000 | 0,000 | 1,077 | 0,000 | 1,077 | 327.427,222 | 3,877 | 1.178.737,999 | 0,000 | 0,000 |
| 310 | 2.090 | 2023 | Factory and Quarry | 312.037,000 | t Product manufactured | Vehicle and heating diesel fuel | 0,000 | 0,000 | 979,166 | 0,000 | 0,000 | 3.524,998 | 0,000 | 0,000 | 0,011 | 0,000 | emas_statement | 2.090 | 0,000 | 0,000 | 0,003 | 0,000 | 0,003 | 979,166 | 0,011 | 3.524,998 | 0,000 | 0,000 |
| 311 | 2.090 | 2024 | Factory and Quarry | 436.485,000 | t Product manufactured | Vehicle and heating diesel fuel | 0,000 | 0,000 | 805,277 | 0,000 | 0,000 | 2.898,997 | 0,000 | 0,000 | 0,007 | 0,000 | emas_statement | 2.090 | 0,000 | 0,000 | 0,002 | 0,000 | 0,002 | 805,277 | 0,007 | 2.898,997 | 0,000 | 0,000 |
| 313 | 2.090 | 2023 | Factory and Quarry | 312.037,000 | t Product manufactured | Use Production-Electricity | 49.283,000 | 0,000 | 0,000 | 0,000 | 0,000 | 0,000 | 0,000 | 0,000 | 0,000 | 0,000 | emas_statement | 2.090 | 0,158 | 0,000 | 0,000 | 0,000 | 0,158 | 49.283,000 | 0,569 | 177.418,800 | 177.418,800 | 0,569 |
| 314 | 2.090 | 2024 | Factory and Quarry | 436.485,000 | t Product manufactured | Use Production-Electricity | 50.012,000 | 0,000 | 0,000 | 0,000 | 0,000 | 0,000 | 0,000 | 0,000 | 0,000 | 0,000 | emas_statement | 2.090 | 0,115 | 0,000 | 0,000 | 0,000 | 0,115 | 50.012,000 | 0,412 | 180.043,200 | 180.043,200 | 0,412 |
| 420 | 2.090 | 2025 | Factory | 330.927,000 | t Clinker fabricated | Production—Fossil fuels | 0,000 | 0,000 | 349.257,777 | 0,000 | 0,000 | 1.257.327,997 | 0,000 | 0,000 | 3,799 | 0,000 | emas_statement | 2.090 | 0,000 | 0,000 | 1,055 | 0,000 | 1,055 | 349.257,777 | 3,799 | 1.257.327,997 | 0,000 | 0,000 |
| 421 | 2.090 | 2025 | Factory and Quarry | 480.744,000 | t Product manufactured | Vehicle and heating diesel fuel | 0,000 | 0,000 | 959,722 | 0,000 | 0,000 | 3.454,999 | 0,000 | 0,000 | 0,007 | 0,000 | emas_statement | 2.090 | 0,000 | 0,000 | 0,002 | 0,000 | 0,002 | 959,722 | 0,007 | 3.454,999 | 0,000 | 0,000 |
| 422 | 2.090 | 2025 | Factory and Quarry | 480.744,000 | t Product manufactured | Use Production-Electricity | 54.135,000 | 0,000 | 0,000 | 0,000 | 0,000 | 0,000 | 0,000 | 0,000 | 0,000 | 0,000 | emas_statement | 2.090 | 0,113 | 0,000 | 0,000 | 0,000 | 0,113 | 54.135,000 | 0,405 | 194.886,000 | 194.886,000 | 0,405 |
| Year | Center | |||||||||||||||||||||||||||
| ∑ = 3,396,716.000 |
|
Renewable energies |
Energías Renovables
Configuración Colores
| wdt_ID | userid | Year | Center | Units Pr. | Units | Uses | Renewable consumed from third parties (MWh) | Renewable consumed self-generated (MWh) | Renewable generated (MWh) | post_author | Total renewable energy consumed (MWh) | Ratio of MWh of renewable energy consumed toUnits Pr. | Ratio of MWh of renewable energy generated perUnits of Pr. |
|---|---|---|---|---|---|---|---|---|---|---|---|---|---|
| 134 | 2.090 | 2024 | Factory | 436.485,000 | t Product manufactured | Production | 41.651,700 | 0,000 | 0,000 | 2.090 | 41.651,700 | 0,0954 | 0,0000 |
| 135 | 2.090 | 2023 | Factory | 312.037,000 | t Product manufactured | Production | 34.875,900 | 0,000 | 0,000 | 2.090 | 34.875,900 | 0,1118 | 0,0000 |
| 177 | 2.090 | 2025 | Factory | 480.744,000 | t Product manufactured | Production | 36.866,000 | 0,000 | 0,000 | 2.090 | 36.866,000 | 0,0767 | 0,0000 |
| wdt_ID | userid | Year | Center | Units | post_author | ||||||||
| ∑ = 1,229,266.000 |
Note: Renewable electrical energy through PPA contracts and Fortia marketing company certificate with 4.7% renewable.
 |
Water use and management |
Water management
River water is consumed in the equipment cooling process and to reduce diffuse emissions in the quarry area.
Environmental management and control
Specific process water consumption from the municipal water supply has decreased in absolute terms and has also decreased in relative terms compared to 2024.
Evolution of specific metrics and ratios
Water consumption (m³) and ratios
Water Uses
| state | wdt_ID | userid | Year | Center | Units Pr. | Unit | Origin of water | Uses | m3 | ID | post_author | Ratio (Units Pr. |
|---|---|---|---|---|---|---|---|---|---|---|---|---|
| VALIDATED | 250 | 2.090 | 2023 | Factory and Quarry | 312.037,000 | t Product manufactured | Surface catchment | Cooling, Irrigation | 21.733,000 | 138.995 | 2.090 | 0,069649 |
| VALIDATED | 251 | 2.090 | 2024 | Factory and Quarry | 436.485,000 | t Product manufactured | Surface catchment | Cooling, Irrigation | 24.549,000 | 138.995 | 2.090 | 0,056242 |
| VALIDATED | 253 | 2.090 | 2023 | Factory and Quarry | 312.037,000 | t Product manufactured | Public supply network | Various uses | 3.102,000 | 138.995 | 2.090 | 0,009941 |
| VALIDATED | 254 | 2.090 | 2024 | Factory and Quarry | 436.485,000 | t Product manufactured | Public supply network | Various uses | 6.438,000 | 138.995 | 2.090 | 0,014750 |
| VALIDATED | 380 | 2.090 | 2025 | Factory and Quarry | 480.744,000 | t Product manufactured | Surface catchment | Cooling, Irrigation | 24.053,000 | 138.995 | 2.090 | 0,050033 |
| VALIDATED | 381 | 2.090 | 2025 | Factory and Quarry | 480.744,000 | t Product manufactured | Public supply network | Various uses | 4.077,000 | 138.995 | 2.090 | 0,008481 |
| state | wdt_ID | userid | Year | Center | Unit | Origin of water | Uses | ID | post_author |
Note:
 |
Waste water discharge management |
Wastewater management
The discharge of rainwater and sanitary water into watercourses, after passing through our treatment systems, is another environmental aspect of our activity. Regular checks are therefore carried out on the characteristics of this water in order to preserve the quality of the receiving environment, both in terms of water collected from the factory and from the quarry.
Environmental management and control
A program of measures to improve the treatment facilities for quarry waste is in place and will be implemented over the coming years, with a final deadline of 2027.
Public waterway receiving the discharge: Burunda River
Evolution of specific metrics and ratios
| state | wdt_ID | userid | Year | Center | Units Pr. | Unit | Total Volume m3 | Ratio (Units Pr. | Destination | Pollutant | Concentration | Limit | Conc. unit | Mass value kg | RatioPr.Units Pr. | ID | post_author |
|---|---|---|---|---|---|---|---|---|---|---|---|---|---|---|---|---|---|
| VALIDATED | 812 | 2.090 | 2023 | Factory | 312.037,000 | Tn product manufactured | 0,000 | Public waterway | Suspended solids | 14,000 | 35 | mg/l | 0,000 | 138.995 | 2.090 | ||
| VALIDATED | 813 | 2.090 | 2024 | Factory | 436.485,000 | Tn product manufactured | 0,000 | Public waterway | Suspended solids | 12,000 | 35 | mg/l | 0,000 | 138.995 | 2.090 | ||
| VALIDATED | 815 | 2.090 | 2023 | Factory | 312.037,000 | Tn product manufactured | 0,000 | Public waterway | Chemical oxygen demand | 14,000 | 125 | mg/l | 0,000 | 138.995 | 2.090 | ||
| VALIDATED | 816 | 2.090 | 2024 | Factory | 436.485,000 | Tn product manufactured | 0,000 | Public waterway | Chemical oxygen demand | 18,000 | 125 | mg/l | 0,000 | 138.995 | 2.090 | ||
| VALIDATED | 818 | 2.090 | 2023 | Factory | 312.037,000 | Tn product manufactured | 0,000 | Public waterway | T.P.H. | 1,300 | 5 | mg/l | 0,000 | 138.995 | 2.090 | ||
| VALIDATED | 819 | 2.090 | 2024 | Factory | 436.485,000 | Tn product manufactured | 0,000 | Public waterway | T.P.H. | 1,600 | 5 | mg/l | 0,000 | 138.995 | 2.090 | ||
| VALIDATED | 821 | 2.090 | 2023 | Quarry | 399.456,000 | Marl production | 0,000 | Public waterway | Suspended solids | 17,000 | 65 | mg/l | 0,000 | 138.995 | 2.090 | ||
| VALIDATED | 822 | 2.090 | 2024 | Quarry | 439.370,000 | Marl production | 0,000 | Public waterway | Suspended solids | 21,000 | 65 | mg/l | 0,000 | 138.995 | 2.090 | ||
| VALIDATED | 825 | 2.090 | 2023 | Quarry | 399.456,000 | Tn product manufactured | 0,000 | Public waterway | Chemical oxygen demand | 10,000 | 300 | mg/l | 0,000 | 138.995 | 2.090 | ||
| VALIDATED | 826 | 2.090 | 2023 | Quarry | 399.456,000 | Tn product manufactured | 0,000 | Public waterway | T.P.H. | 0,050 | 5 | mg/l | 0,000 | 138.995 | 2.090 | ||
| VALIDATED | 827 | 2.090 | 2024 | Quarry | 439.370,000 | Tn product manufactured | 0,000 | Public waterway | Chemical oxygen demand | 10,000 | 300 | mg/l | 0,000 | 138.995 | 2.090 | ||
| VALIDATED | 828 | 2.090 | 2024 | Quarry | 439.370,000 | Tn product manufactured | 0,000 | Public waterway | T.P.H. | 0,100 | 5 | mg/l | 0,000 | 138.995 | 2.090 | ||
| VALIDATED | 954 | 2.090 | 2025 | Factory | 480.744,000 | Tn product manufactured | 0,000 | Public waterway | Suspended solids | 13,000 | 35 | mg/l | 0,000 | 138.995 | 2.090 | ||
| VALIDATED | 955 | 2.090 | 2025 | Factory | 480.744,000 | Tn product manufactured | 0,000 | Public waterway | Chemical oxygen demand | 15,000 | 125 | mg/l | 0,000 | 138.995 | 2.090 | ||
| VALIDATED | 956 | 2.090 | 2025 | Factory | 480.744,000 | Tn product manufactured | 0,000 | Public waterway | T.P.H. | 1,200 | 5 | mg/l | 0,000 | 138.995 | 2.090 | ||
| VALIDATED | 957 | 2.090 | 2025 | Quarry | 488.041,000 | Marl production | 0,000 | Public waterway | Suspended solids | 55,000 | 65 | mg/l | 0,000 | 138.995 | 2.090 | ||
| VALIDATED | 958 | 2.090 | 2025 | Quarry | 488.041,000 | Tn product manufactured | 0,000 | Public waterway | Chemical oxygen demand | 8,000 | 300 | mg/l | 0,000 | 138.995 | 2.090 | ||
| VALIDATED | 959 | 2.090 | 2025 | Quarry | 488.041,000 | Tn product manufactured | 0,000 | Public waterway | T.P.H. | 0,100 | 5 | mg/l | 0,000 | 138.995 | 2.090 | ||
| state | wdt_ID | userid | Year | Center | Unit | Destination | Pollutant | ||||||||||
| ∑ = 7,668,399.000 |
 |
Atmospheric emissions |
Emissions management
In 2025, 286,155 metric tons of CO2 were emitted into the atmosphere as a result of the limestone decarbonation process—through the conversion of calcareous marl into calcium oxide at the high temperatures of the process—and the combustion process—through the oxidation of carbon in fuels in the presence of oxygen. These emissions represented a total factor of 864.7 kg CO2/t of clinker. This ratio has decreased slightly compared to 2024, by approximately 1.7%. Our ongoing concern for reducing emission levels has resulted in maintaining them below legal limits and improving our most significant environmental impact. Data on 37 pollutants are reported annually to the State Register of Emissions and Polluting Sources, PRTR Spain, in the form of pollutant load from channeled emissions. Most atmospheric pollutants have not exceeded the threshold above which reporting is required, but given the policy of transparency in environmental matters, all pollutants are reported regardless of this threshold. For more information, please visit www.prtr.es
The use of diesel fuel in 2025 would have generated the equivalent of 3,279 kg of CO2 through CH4 and N2O emissions.
Although these are not confined emissions, it should be noted in this section that the maintenance of refrigeration equipment has generated emissions of fluorinated gases that, in their GHG equivalent, would amount to 11 metric tons of CO2.
Environmental management and control
The Olazagutía facilities have 19 main emission sources per chimney, included in the kiln process, and the rest of the fuel grinding, cement, and raw material transport processes. There is also a source of pollution from the crushing of raw materials from the marl quarry. All of these have purification systems based on bag filters, which are some of the best available techniques in the sector. There are continuous pollutant measurement systems for the kilns, with periodic measurements taken at all the main sources and checks carried out on the rest. The particulate emissions recorded at the main sources where they are measured in accordance with regulations, expressed inmg/Nm³, are below the limit value established by law in the Integrated Environmental Authorization, which is 10mg/Nm³. With regard to the quarry crusher burner, the limit value is 50mg/Nm3. The combustion process primarily generates carbon dioxide, sulfur dioxide, and nitrogen oxides, whose concentrations—inmg/Nm³ at 10% oxygen—are continuously monitored against the emission limits established for 2025, which were 350mg/Nm³ forNOx and 400mg/Nm³ forSO₂. The absolute and relative mass emission values forSO₂ relative to clinker production were similar to those in 2024. As forNOx mass emissions, they decreased in both absolute and relative terms. The minimization of emissions resulting from the transfer and movement of powdery materials has been achieved through the adoption of a series of preventive measures such as paving in traffic areas, conveyor belt fairings, suction devices at transfer, loading, and unloading points, wind protection screens, and watering of tracks and roads, among others. For air quality inspection, continuous monitoring is carried out by control booths installed in the factory environment (Olazagutía), which provide real-time data.Emissions from channeled sources
Particulate matter emission
It should be noted that the Line 7 furnace remained shut down throughout 2025 due to production adjustments. Emission of combustion gases
It should be noted that Kiln 7 remained shut down during 2023, 2024, and 2025 due to production adjustments. Diffuse source emissions
The data collected by these stations is shared with the Environmental Agency.
| state | wdt_ID | userid | Year | Centre/Focus | Units Pr. | Unit | Origin/Type | Pollutant | Concentration | Conc. unit | Limit | Mass emission (kg) | ID | post_author | Ratio (kgUnits Pr. |
|---|---|---|---|---|---|---|---|---|---|---|---|---|---|---|---|
| VALIDATED | 553 | 2.090 | 2023 | Factory | 312.037,000 | Tn product manufactured | Vehicle emission source | Particulate matter emissions | 0,000 | kg/year | 2.532,000 | 138.995 | 2.090 | 0,008 | |
| VALIDATED | 554 | 2.090 | 2024 | Factory | 436.485,000 | Tn product manufactured | Vehicle emission source | Particulate matter emissions | 0,000 | kg/year | 5.270,000 | 138.995 | 2.090 | 0,012 | |
| VALIDATED | 556 | 2.090 | 2023 | Factory | 312.037,000 | Tn product manufactured | Vehicle emission focus, Transportation emissions | NOx combustion gas emissions | 0,000 | kg/year | 306.106,000 | 138.995 | 2.090 | 0,981 | |
| VALIDATED | 557 | 2.090 | 2024 | Factory | 436.485,000 | Tn product manufactured | Vehicle emission focus, Transportation emissions | NOx combustion gas emissions | 0,000 | kg/year | 317.489,000 | 138.995 | 2.090 | 0,727 | |
| VALIDATED | 559 | 2.090 | 2023 | Factory | 312.037,000 | Tn product manufactured | Vehicle emission focus, Transportation emissions | Combustion gas emissions SO2 | 0,000 | kg/year | 167.360,000 | 138.995 | 2.090 | 0,536 | |
| VALIDATED | 560 | 2.090 | 2024 | Factory | 436.485,000 | Tn product manufactured | Vehicle emission focus, Transportation emissions | Combustion gas emissions SO2 | 0,000 | kg/year | 213.733,000 | 138.995 | 2.090 | 0,490 | |
| VALIDATED | 562 | 2.090 | 2023 | Factory | 312.037,000 | Tn product manufactured | Diffuse emissions | NO2 Olazagutía Station | 5,000 | µg/m3 | 138.995 | 2.090 | 0,000 | ||
| VALIDATED | 563 | 2.090 | 2024 | Factory | 436.485,000 | Tn product manufactured | Diffuse emissions | NO2 Olazagutía Station | 5,000 | µg/m3 | 138.995 | 2.090 | 0,000 | ||
| VALIDATED | 565 | 2.090 | 2023 | Factory | 312.037,000 | Tn product manufactured | Diffuse emissions | SO2 Olazagutía Station | 4,000 | µg/m3 | 138.995 | 2.090 | 0,000 | ||
| VALIDATED | 566 | 2.090 | 2024 | Factory | 436.485,000 | Tn product manufactured | Diffuse emissions | SO2 Olazagutía Station | 2,000 | µg/m3 | 138.995 | 2.090 | 0,000 | ||
| VALIDATED | 568 | 2.090 | 2023 | Factory | 312.037,000 | Tn product manufactured | Diffuse emissions | PM10 Olazagutía Station | 17,000 | µg/m3 | 138.995 | 2.090 | 0,000 | ||
| VALIDATED | 569 | 2.090 | 2024 | Factory | 436.485,000 | Tn product manufactured | Diffuse emissions | PM10 Olazagutía Station | 12,000 | µg/m3 | 138.995 | 2.090 | 0,000 | ||
| VALIDATED | 573 | 2.090 | 2023 | Factory | 312.037,000 | Tn product manufactured | Diffuse emissions | NO2 Alsasua Station | 14,000 | µg/m3 | 138.995 | 2.090 | 0,000 | ||
| VALIDATED | 574 | 2.090 | 2023 | Factory | 312.037,000 | Tn product manufactured | Diffuse emissions | SO2 Alsasua Station | 2,000 | µg/m3 | 138.995 | 2.090 | 0,000 | ||
| VALIDATED | 575 | 2.090 | 2023 | Factory | 312.037,000 | Tn product manufactured | Diffuse emissions | PM10 Alsasua Station | 14,000 | µg/m3 | 138.995 | 2.090 | 0,000 | ||
| VALIDATED | 576 | 2.090 | 2024 | Factory | 436.485,000 | Tn product manufactured | Diffuse emissions | NO2 Alsasua Station | 10,000 | µg/m3 | 138.995 | 2.090 | 0,000 | ||
| VALIDATED | 577 | 2.090 | 2024 | Factory | 436.485,000 | Tn product manufactured | Diffuse emissions | SO2 Alsasua Station | 2,000 | µg/m3 | 138.995 | 2.090 | 0,000 | ||
| VALIDATED | 578 | 2.090 | 2024 | Factory | 436.485,000 | Tn product manufactured | Diffuse emissions | PM10 Alsasua Station | 14,000 | µg/m3 | 138.995 | 2.090 | 0,000 | ||
| VALIDATED | 778 | 2.090 | 2025 | Factory | 480.744,000 | Tn product manufactured | Vehicle emission source | Particulate matter emissions | 0,000 | kg/year | 5.983,000 | 138.995 | 2.090 | 0,012 | |
| VALIDATED | 779 | 2.090 | 2025 | Factory | 480.744,000 | Tn product manufactured | Vehicle emission focus, Transportation emissions | NOx combustion gas emissions | 0,000 | kg/year | 289.268,000 | 138.995 | 2.090 | 0,602 | |
| VALIDATED | 780 | 2.090 | 2025 | Factory | 480.744,000 | Tn product manufactured | Vehicle emission focus, Transportation emissions | Combustion gas emissions SO2 | 0,000 | kg/year | 222.829,000 | 138.995 | 2.090 | 0,464 | |
| VALIDATED | 781 | 2.090 | 2025 | Factory | 480.744,000 | Tn product manufactured | Diffuse emissions | NO2 Olazagutía Station | 4,000 | µg/m3 | 138.995 | 2.090 | 0,000 | ||
| VALIDATED | 782 | 2.090 | 2025 | Factory | 480.744,000 | Tn product manufactured | Diffuse emissions | NO2 Alsasua Station | 9,000 | µg/m3 | 138.995 | 2.090 | 0,000 | ||
| VALIDATED | 783 | 2.090 | 2025 | Factory | 480.744,000 | Tn product manufactured | Diffuse emissions | SO2 Olazagutía Station | 4,000 | µg/m3 | 138.995 | 2.090 | 0,000 | ||
| VALIDATED | 784 | 2.090 | 2025 | Factory | 480.744,000 | Tn product manufactured | Diffuse emissions | SO2 Alsasua Station | 2,000 | µg/m3 | 138.995 | 2.090 | 0,000 | ||
| VALIDATED | 785 | 2.090 | 2025 | Factory | 480.744,000 | Tn product manufactured | Diffuse emissions | PM10 Olazagutía Station | 13,000 | µg/m3 | 138.995 | 2.090 | 0,000 | ||
| VALIDATED | 786 | 2.090 | 2025 | Factory | 480.744,000 | Tn product manufactured | Diffuse emissions | PM10 Alsasua Station | 13,000 | µg/m3 | 138.995 | 2.090 | 0,000 | ||
| state | wdt_ID | userid | Year | Centre/Focus | Unit | Origin/Type | Pollutant | ID | post_author | ||||||
| ∑ = 11,063,394.000 |
Other emissions
Noise emissions in the vicinity of manufacturing facilities cause disturbances to the population and wildlife.
In the case of the Olazagutía factory, located in an industrial park surrounded by the busy N-I highway and railroad tracks, the impact on the environment is not particularly significant. However, a series of measures have been implemented to minimize noise, such as preventive measures on the conveyor belt, adaptation of compressor rooms, etc.
An annual measurement campaign is carried out at representative points on the periphery of the quarry in order to ensure compliance with the legal requirements established in accordance with sectoral noise regulations. The measurements taken in 2013 did not meet the criteria established in Royal Decree 1367/2007, so new measurements were taken and a corresponding report was produced in the first quarter of 2014 in accordance with the criteria of that regulation.
The conclusions of this report by the Authorized Control Body of the Government of Navarre are as follows:
“It can be determined that the facilities of the company CEMENTOS PORTLAND VALDERRIVAS, S.A., located at Calle Estación, 37, Olazagutía (Navarre), comply with the outdoor ambient limit values set forth in Annex III of Royal Decree 1367/2007.”
The annual quarry survey was conducted in November 2025 and was in compliance with the applicable standard.
 |
CO2 emissions |
CO₂ emissions per center.
| wdt_ID | userid | Year | Center | Units Pr. | Units | Origin/Type | CO2eq Direct (S1) | CO2eq Indirect (S2) | CO2eq Indirect (S3) | CO2eq Saved/Compensated | ID | post_author | Category GHG (S3) | T CO2eq Total | TotalUnits Pr. | IndirectUnits ratio | DirectUnits ratio | Ratio of CO2eq Savings toUnits Pr. |
|---|---|---|---|---|---|---|---|---|---|---|---|---|---|---|---|---|---|---|
| 391 | 2.090 | 2023 | Factory | 303.245,000 | t Clinker fabricated | Decarbonization of the MMPP and Combustion. | 268.805,000 | 0,000 | 0,000 | 0,000 | 138.995 | 2.090 | 268.805,000 | 0,886428 | 0,000000 | 0,886428 | 0,000000 | |
| 392 | 2.090 | 2024 | Factory | 304.012,000 | t Clinker fabricated | Decarbonization of the MMPP and Combustion. | 265.939,000 | 0,000 | 0,000 | 0,000 | 138.995 | 2.090 | 265.939,000 | 0,874765 | 0,000000 | 0,874765 | 0,000000 | |
| 393 | 2.090 | 2024 | Factory and Quarry | 436.485,000 | t Product manufactured | CO2 equivalent emissions from diesel fuel for transportation and heating | 2,939 | 0,000 | 0,000 | 0,000 | 138.995 | 2.090 | 2,939 | 0,000007 | 0,000000 | 0,000007 | 0,000000 | |
| 394 | 2.090 | 2024 | Factory | 436.485,000 | t Product manufactured | Refrigerant gas leaks | 3,100 | 0,000 | 0,000 | 0,000 | 138.995 | 2.090 | 3,100 | 0,000007 | 0,000000 | 0,000007 | 0,000000 | |
| 395 | 2.090 | 2024 | Factory | 436.485,000 | t Product manufactured | CO2 emissions electric energy Non-renewable | 0,000 | 2.365,900 | 0,000 | 0,000 | 138.995 | 2.090 | 2.365,900 | 0,005420 | 0,005420 | 0,000000 | 0,000000 | |
| 396 | 2.090 | 2024 | Factory | 436.485,000 | t Product manufactured | CO2 Renewable electricity consumption, energy supplier, and PPAs | 0,000 | 0,000 | 0,000 | -11.787,420 | 138.995 | 2.090 | 0,000 | 0,000000 | 0,000000 | 0,000000 | 0,027005 | |
| 801 | 2.090 | 2025 | Factory | 330.927,000 | t Clinker fabricated | Decarbonization of the MMPP and Combustion. | 286.155,000 | 0,000 | 0,000 | 0,000 | 138.995 | 2.090 | 286.155,000 | 0,864707 | 0,000000 | 0,864707 | 0,000000 | |
| 802 | 2.090 | 2025 | Factory and Quarry | 480.744,000 | t Product manufactured | CO2 equivalent emissions from diesel fuel for transportation and heating | 276,000 | 0,000 | 0,000 | 0,000 | 138.995 | 2.090 | 276,000 | 0,000574 | 0,000000 | 0,000574 | 0,000000 | |
| 803 | 2.090 | 2025 | Factory | 480.744,000 | t Product manufactured | Refrigerant gas leaks | 11,000 | 0,000 | 0,000 | 0,000 | 138.995 | 2.090 | 11,000 | 0,000023 | 0,000000 | 0,000023 | 0,000000 | |
| 804 | 2.090 | 2025 | Factory | 480.744,000 | t Product manufactured | CO2 emissions electric energy Non-renewable | 0,000 | 4.887,950 | 0,000 | 0,000 | 138.995 | 2.090 | 4.887,950 | 0,010167 | 0,010167 | 0,000000 | 0,000000 | |
| 805 | 2.090 | 2025 | Factory | 480.744,000 | t Product manufactured | CO2 Renewable electricity consumption, energy supplier, and PPAs | 0,000 | 0,000 | 0,000 | -10.432,200 | 138.995 | 2.090 | 0,000 | 0,000000 | 0,000000 | 0,000000 | 0,021700 | |
| wdt_ID | userid | Year | Center | Units Pr. | Units | Origin/Type | ID | post_author | Category GHG (S3) |
Note: Scope 1 (S1) emissions include only those verified under the European Union's Greenhouse Gas Emissions Trading Directive and implementing regulations.
 |
Waste production and management |
GenerWaste generation
The cement and mortar manufacturing process does not give rise to the generation of waste, which is derived from facility maintenance activities, modification works, building cleaning, laboratory, medical service, among others. The management criteria established are based on minimization in the generation process, reuse and recycling, with internal segregation and appropriate external management for each type of waste.
Environmental management and control
The generation of Hazardous waste Hazardous increased in absolute terms and remained stable in relative terms. The generation of Hazardous waste Hazardous increased significantly in both absolute and relative terms due to the management of large quantities of reusable, high-density waste.
By waste category, the most significant types this year, within the Hazardous category, were oily sludge from the oil/grease separator, rags/contaminated materials, and used oil. Within the Hazardous waste category, the generation of refractory bricks Hazardous .
Hazardous Waste Reduction Plan
A Hazardous Waste Minimization Study is available Hazardous the 2024–2027 period, prepared in accordance with the guidelines and instructions established by the Department of Rural Development and the Environment on its website. After assessing and selecting the Hazardous waste Hazardous , priority has been given to rags and absorbents contaminated with hydrocarbons, classified under LER 15 02 02.
The measures selected to reduce this Hazardous waste by 11% Hazardous using even more absorbent material for spills and leaks, as well as conducting a detailed study of leak-control equipment. To this end, the actions would primarily consist of continuing to train maintenance staff and searching for a material that is even more absorbent than the sepiolite currently in use.
Evolution of specific metrics and ratios
Generación de residuos
Destination of waste
Type and destination
| wdt_ID | userid | Year | Center | Units Pr. | Units | Non Hazardous | Hazardous | Disposal/ Controlled landfill | Other treatments | Recovery | By-products | post_author | NP Ratio (kg)Units Pr. | RP Ratio (kg)Units Pr. | Totals (t) | Total ratio (t)Units Pr. |
|---|---|---|---|---|---|---|---|---|---|---|---|---|---|---|---|---|
| 135 | 2.090 | 2023 | Factory and Quarry | 312.037,000 | Tn product manufactured | 223,324 | 32,051 | 101,930 | 153,445 | 0,000 | 2.090 | 0,716 | 0,10271538311 | 255,38 | 0,000818412560 | |
| 136 | 2.090 | 2024 | Factory and Quarry | 436.485,000 | Tn product manufactured | 395,311 | 25,201 | 43,682 | 376,830 | 0,000 | 2.090 | 0,906 | 0,05773623378 | 420,51 | 0,000963405386 | |
| 159 | 2.090 | 2025 | Factory and Quarry | 480.744,000 | Tn product manufactured | 567,180 | 29,030 | 11,755 | 555,425 | 0,000 | 2.090 | 1,180 | 0,06038556903 | 596,21 | 0,001240181885 | |
| wdt_ID | userid | Year | Center | Units | post_author | |||||||||||
| ∑ = 1,229,266.000 |
List of waste
| wdt_ID | userid | Year | Center | Units Pr. | Units | Description of the waste | CER/LER code. | Treatment | Hazardous | Quantity (t) | post_author | Ratio quantity (t)/pdU. |
|---|---|---|---|---|---|---|---|---|---|---|---|---|
| 1.978 | 2.090 | 2023 | Factory and Quarry | 312.037,000 | t Product manufactured | Scrap | 170405 | R13 | No | 30,420 | 2.090 | 0,000097488439 |
| 1.979 | 2.090 | 2023 | Factory and Quarry | 312.037,000 | t Product manufactured | Mixed debris | 170904 | D5 | No | 4,200 | 2.090 | 0,000013459942 |
| 1.980 | 2.090 | 2023 | Factory and Quarry | 312.037,000 | t Product manufactured | Packaging waste | 150106 | D5 | No | 16,900 | 2.090 | 0,000054160244 |
| 1.981 | 2.090 | 2023 | Factory and Quarry | 312.037,000 | t Product manufactured | Wood | 170201 | R13 | No | 20,800 | 2.090 | 0,000066658762 |
| 1.982 | 2.090 | 2023 | Factory and Quarry | 312.037,000 | t Product manufactured | Sewage sludge | 200304 | R10 | No | 13,260 | 2.090 | 0,000042494961 |
| 1.983 | 2.090 | 2023 | Factory and Quarry | 312.037,000 | t Product manufactured | Rubber | 070299 | R13 | No | 1,860 | 2.090 | 0,000005960832 |
| 1.985 | 2.090 | 2023 | Factory and Quarry | 312.037,000 | t Product manufactured | Contaminated absorbents and rags | 150202 | D15 | Yes | 6,735 | 2.090 | 0,000021583979 |
| 1.986 | 2.090 | 2023 | Factory and Quarry | 312.037,000 | t Product manufactured | Oily sludge from the separator | 130508 | D09 | Yes | 13,680 | 2.090 | 0,000043840955 |
| 1.987 | 2.090 | 2023 | Factory and Quarry | 312.037,000 | t Product manufactured | Used oil | 130205 | R13 | Yes | 6,660 | 2.090 | 0,000021343623 |
| 1.988 | 2.090 | 2023 | Factory and Quarry | 312.037,000 | t Product manufactured | Oil filters | 160107 | R13 | Yes | 0,150 | 2.090 | 0,000000480712 |
| 1.989 | 2.090 | 2023 | Factory and Quarry | 312.037,000 | t Product manufactured | Laboratory reagents | 160506 | D15 | Yes | 0,330 | 2.090 | 0,000001057567 |
| 1.990 | 2.090 | 2023 | Factory and Quarry | 312.037,000 | t Product manufactured | Safety Kleen | 140603 | R13 | Yes | 0,385 | 2.090 | 0,000001233828 |
| 1.991 | 2.090 | 2023 | Factory and Quarry | 312.037,000 | t Product manufactured | Water with hydrocarbons | 130507 | R13 | Yes | 2,055 | 2.090 | 0,000006585757 |
| 1.992 | 2.090 | 2024 | Factory and Quarry | 436.485,000 | t Product manufactured | Scrap | 170504 | R13 | No | 155,430 | 2.090 | 0,000356094711 |
| 1.993 | 2.090 | 2024 | Factory and Quarry | 436.485,000 | t Product manufactured | Mixed debris | 170904 | D15 | No | 39,280 | 2.090 | 0,000089991638 |
| 1.994 | 2.090 | 2024 | Factory and Quarry | 436.485,000 | t Product manufactured | Packaging waste | 150106 | R13 | No | 7,740 | 2.090 | 0,000017732568 |
| 1.995 | 2.090 | 2024 | Factory and Quarry | 436.485,000 | t Product manufactured | Wood | 170201 | R13 | No | 7,320 | 2.090 | 0,000016770336 |
| 1.996 | 2.090 | 2024 | Factory and Quarry | 436.485,000 | t Product manufactured | Sewage sludge | 200304 | R10 | No | 12,260 | 2.090 | 0,000028088021 |
| 1.997 | 2.090 | 2024 | Factory and Quarry | 436.485,000 | t Product manufactured | Rubber | 070299 | R13 | No | 1,440 | 2.090 | 0,000003299082 |
| 1.998 | 2.090 | 2024 | Factory and Quarry | 436.485,000 | t Product manufactured | Electronic equipment | 160214 | R13 | No | 0,860 | 2.090 | 0,000001970285 |
| 1.999 | 2.090 | 2024 | Factory and Quarry | 436.485,000 | t Product manufactured | Contaminated absorbents and rags | 150202 | D15 | Yes | 5,715 | 2.090 | 0,000013093233 |
| 2.000 | 2.090 | 2024 | Factory and Quarry | 436.485,000 | t Product manufactured | Oily sludge from the separator | 130508 | D09 | Yes | 9,040 | 2.090 | 0,000020710906 |
| 2.001 | 2.090 | 2024 | Factory and Quarry | 436.485,000 | t Product manufactured | Used oil | 130205 | R13 | Yes | 4,966 | 2.090 | 0,000011377252 |
| 2.002 | 2.090 | 2024 | Factory and Quarry | 436.485,000 | t Product manufactured | Oil filters | 160107 | R13 | Yes | 0,150 | 2.090 | 0,000000343654 |
| 2.003 | 2.090 | 2024 | Factory and Quarry | 436.485,000 | t Product manufactured | Reactive laboratory waste | 160506 | D15 | Yes | 0,118 | 2.090 | 0,000000270341 |
| 2.004 | 2.090 | 2024 | Factory and Quarry | 436.485,000 | t Product manufactured | Inorganic laboratory waste | 160507 | D15 | Yes | 0,054 | 2.090 | 0,000000123716 |
| 2.005 | 2.090 | 2024 | Factory and Quarry | 436.485,000 | t Product manufactured | Expired additives | 160508 | D15 | Yes | 3,720 | 2.090 | 0,000008522630 |
| 2.006 | 2.090 | 2024 | Factory and Quarry | 436.485,000 | t Product manufactured | Filtration materials | 150203 | D15 | No | 17,660 | 2.090 | 0,000040459581 |
| 2.007 | 2.090 | 2024 | Factory and Quarry | 436.485,000 | t Product manufactured | Refractory brick | 161105 | R05 | No | 170,960 | 2.090 | 0,000391674399 |
| 2.008 | 2.090 | 2024 | Factory and Quarry | 436.485,000 | t Product manufactured | Batteries | 160604 | R13 | No | 0,026 | 2.090 | 0,000000059567 |
| 2.009 | 2.090 | 2024 | Factory and Quarry | 436.485,000 | t Product manufactured | Laboratory alcohol waste | 160508 | D15 | Yes | 0,020 | 2.090 | 0,000000045821 |
| 2.010 | 2.090 | 2024 | Factory and Quarry | 436.485,000 | t Product manufactured | Contaminated plastic containers | 150110 | R13 | Yes | 0,460 | 2.090 | 0,000001053874 |
| 2.011 | 2.090 | 2024 | Factory and Quarry | 436.485,000 | t Product manufactured | Toner | 080317 | D15 | Yes | 0,065 | 2.090 | 0,000000148917 |
| 2.012 | 2.090 | 2024 | Factory and Quarry | 436.485,000 | t Product manufactured | Safety Kleen | 140603 | R13 | Yes | 0,550 | 2.090 | 0,000001260066 |
| 2.013 | 2.090 | 2024 | Factory and Quarry | 436.485,000 | t Product manufactured | Water containing hydrocarbons | 160507 | D15 | Yes | 0,210 | 2.090 | 0,000000481116 |
| 2.014 | 2.090 | 2024 | Factory and Quarry | 436.485,000 | t Product manufactured | Aerosols | 160504 | R13 | Yes | 0,013 | 2.090 | 0,000000029783 |
| 2.015 | 2.090 | 2024 | Factory and Quarry | 436.485,000 | t Product manufactured | Fluorescent | 200121 | R13 | Yes | 0,120 | 2.090 | 0,000000274924 |
| 2.016 | 2.090 | 2023 | Factory and Quarry | 312.037,000 | t Product manufactured | Batteries | 160604 | R13 | No | 0,014 | 2.090 | 0,000000044866 |
| 2.017 | 2.090 | 2023 | Factory and Quarry | 312.037,000 | t Product manufactured | Refractory brick | 161105 | R05 | No | 74,620 | 2.090 | 0,000239138307 |
| 2.019 | 2.090 | 2023 | Factory and Quarry | 312.037,000 | t Product manufactured | Electronic equipment | 160214 | R13 | No | 1,230 | 2.090 | 0,000003941840 |
| 2.020 | 2.090 | 2023 | Factory and Quarry | 312.037,000 | t Product manufactured | Other mechanical treatment residues | 191212 | D5 | No | 2,500 | 2.090 | 0,000008011870 |
| 2.021 | 2.090 | 2023 | Factory and Quarry | 312.037,000 | t Product manufactured | Laboratory reagents | 160507 | D15 | Yes | 0,030 | 2.090 | 0,000000096142 |
| 2.023 | 2.090 | 2023 | Factory and Quarry | 312.037,000 | t Product manufactured | Fluorescent | 200121 | R13 | Yes | 0,115 | 2.090 | 0,000000368546 |
| 2.024 | 2.090 | 2023 | Factory and Quarry | 312.037,000 | t Product manufactured | Aerosols | 160504 | R13 | Yes | 0,011 | 2.090 | 0,000000035252 |
| 2.025 | 2.090 | 2023 | Factory and Quarry | 312.037,000 | t Product manufactured | Toner | 080317 | D15 | Yes | 0,035 | 2.090 | 0,000000112166 |
| 2.026 | 2.090 | 2023 | Factory and Quarry | 312.037,000 | t Product manufactured | Contaminated plastic containers | 150110 | R13 | Yes | 1,865 | 2.090 | 0,000005976855 |
| 2.070 | 2.090 | 2023 | Factory and Quarry | 312.037,000 | t Product manufactured | Filtration materials | 150203 | D5 | No | 57,520 | 2.090 | 0,000184337114 |
| 2.634 | 2.090 | 2025 | Factory and Quarry | 480.744,000 | t Product manufactured | Scrap | 170504 | R13 | No | 155,020 | 2.090 | 0,000322458523 |
| 2.635 | 2.090 | 2025 | Factory and Quarry | 480.744,000 | t Product manufactured | Mixed debris | 170904 | D15 | No | 22,680 | 2.090 | 0,000047176876 |
| 2.636 | 2.090 | 2025 | Factory and Quarry | 480.744,000 | t Product manufactured | Packaging waste | 150106 | R13 | No | 15,700 | 2.090 | 0,000032657714 |
| 2.637 | 2.090 | 2025 | Factory and Quarry | 480.744,000 | t Product manufactured | Wood | 170201 | R13 | No | 16,680 | 2.090 | 0,000034696221 |
| 2.638 | 2.090 | 2025 | Factory and Quarry | 480.744,000 | t Product manufactured | Sewage sludge | 200304 | R10 | No | 12,200 | 2.090 | 0,000025377332 |
| 2.639 | 2.090 | 2025 | Factory and Quarry | 480.744,000 | t Product manufactured | Rubber | 070299 | R13 | No | 4,120 | 2.090 | 0,000008570050 |
| 2.641 | 2.090 | 2025 | Factory and Quarry | 480.744,000 | t Product manufactured | Contaminated absorbents and rags | 150202 | D15 | Yes | 5,645 | 2.090 | 0,000011742216 |
| 2.642 | 2.090 | 2025 | Factory and Quarry | 480.744,000 | t Product manufactured | Oily sludge from the separator | 130508 | D09 | Yes | 13,740 | 2.090 | 0,000028580700 |
| 2.643 | 2.090 | 2025 | Factory and Quarry | 480.744,000 | t Product manufactured | Used oil | 130205 | R13 | Yes | 4,725 | 2.090 | 0,000009828516 |
| 2.644 | 2.090 | 2025 | Factory and Quarry | 480.744,000 | t Product manufactured | Oil filters | 160107 | R13 | Yes | 0,000 | 2.090 | 0,000000000000 |
| 2.645 | 2.090 | 2025 | Factory and Quarry | 480.744,000 | t Product manufactured | Reactive laboratory waste | 160506 | D15 | Yes | 0,155 | 2.090 | 0,000000322417 |
| 2.646 | 2.090 | 2025 | Factory and Quarry | 480.744,000 | t Product manufactured | Safety Kleen: Residue used as a solvent | 140603 | R13 | Yes | 0,710 | 2.090 | 0,000001476878 |
| 2.648 | 2.090 | 2025 | Factory and Quarry | 480.744,000 | t Product manufactured | Refractory bricks | 161105 | R13 | No | 306,860 | 2.090 | 0,000638302298 |
| 2.649 | 2.090 | 2025 | Factory and Quarry | 480.744,000 | t Product manufactured | Filtration materials | 150203 | R13 | No | 31,160 | 2.090 | 0,000064816202 |
| 2.650 | 2.090 | 2025 | Factory and Quarry | 480.744,000 | t Product manufactured | Electronic equipment | 160214 | R13 | No | 2,760 | 2.090 | 0,000005741101 |
| 2.651 | 2.090 | 2025 | Factory and Quarry | 480.744,000 | t Product manufactured | Expired additives | 160508 | R13 | Yes | 1,705 | 2.090 | 0,000003546586 |
| 2.652 | 2.090 | 2025 | Factory and Quarry | 480.744,000 | t Product manufactured | Spent fats and waxes | 120112 | R13 | Yes | 0,725 | 2.090 | 0,000001508079 |
| 2.653 | 2.090 | 2025 | Factory and Quarry | 480.744,000 | t Product manufactured | Contaminated plastic containers | 150110 | R13 | Yes | 0,305 | 2.090 | 0,000000634433 |
| 2.654 | 2.090 | 2025 | Factory and Quarry | 480.744,000 | t Product manufactured | Batteries containing mercury | 160603 | R13 | Yes | 0,005 | 2.090 | 0,000000010401 |
| 2.655 | 2.090 | 2025 | Factory and Quarry | 480.744,000 | t Product manufactured | Toner | 080317 | R13 | Yes | 0,005 | 2.090 | 0,000000010401 |
| 2.717 | 2.090 | 2025 | Factory and Quarry | 480.744,000 | t Product manufactured | Laboratory alcohol waste | 160508 | D15 | Yes | 0,230 | 2.090 | 0,000000478425 |
| wdt_ID | userid | Year | Center | Units | Description of the waste | CER/LER code. | Hazardous | post_author | ||||
| ∑ = 27,748,115.00 |
 |
Management of raw materials and resources |
Management of material resources
The cement manufacturing process requires the consumption of large quantities of raw materials. The main material used is stone extracted from marl and limestone quarries, although there are also other materials that are essential in smaller quantities to achieve the right composition of intermediate and final products, which are sourced externally. For the most part, these are also natural raw materials from other operations. The natural materials added in the manufacture of clinker, apart from marl and limestone, are: silica sand, limonite, and gypsum. In addition, natural gypsum, more limestone, and limonite/pozzolan are added to manufacture cement. In recent years, the Olazagutía factory, as part of the strategic policy of Grupo Cementos Portland Valderrivas, has been committed to replacing these natural raw materials with waste, as a measure to reduce and optimize their use. These secondary raw materials come from other industrial processes and are used in conjunction with the former in the production of raw meal or as an additive depending on the type of cement to be produced. These Recovery practices Recovery a number of environmental benefits, including a reduction in the extraction of raw materials and the amount of waste sent to landfills, without compromising product quality or the safety of workers and the environment.
Environmental management and control
In 2025, global consumption of alternative raw materials for cement declined both in relative and absolute terms compared to the previous year, 2024.
Evolution of specific metrics and ratios
Resource consumption
Type of materials
| wdt_ID | userid | Year | Center | Units Pr. | Units | Type of Materials | % Recycled | % Hazardous | Quantity of raw materials (t) | Quantity of Auxiliary Materials. (t) | Quantity Containers & Packs (t) | Total (t) | Total ratio (t)/LU. | Hazardous Materials (t) | Recycled Materials (t) |
|---|---|---|---|---|---|---|---|---|---|---|---|---|---|---|---|
| 475 | 2.090 | 2023 | Factory | t Packaged product | Containers and packaging | 0,000 | 0,000 | 0,000 | 0,000 | 18 | 18,00 | 0,000000 | 0,00 | 0,00 | |
| 476 | 2.090 | 2023 | Quarry | 312.037,000 | t Product manufactured | Blasting explosive | 0,000 | 100,000 | 0,000 | 0,000 | 32 | 32,00 | 0,000103 | 32,00 | 0,00 |
| 477 | 2.090 | 2024 | Factory | 6.993,000 | t Packaged product | Containers and packaging | 0,000 | 0,000 | 0,000 | 0,000 | 28 | 28,00 | 0,004004 | 0,00 | 0,00 |
| 478 | 2.090 | 2024 | Quarry | 436.485,000 | t Product manufactured | Blasting explosive | 0,000 | 100,000 | 0,000 | 0,000 | 17 | 17,00 | 0,000039 | 17,00 | 0,00 |
| 764 | 2.090 | 2025 | Factory | 4.436,000 | t Packaged product | Containers and packaging | 0,000 | 0,000 | 0,000 | 0,000 | 22 | 22,00 | 0,004959 | 0,00 | 0,00 |
| 765 | 2.090 | 2025 | Quarry | 480.744,000 | t Product manufactured | Blasting explosive | 0,000 | 100,000 | 0,000 | 0,000 | 39 | 39,00 | 0,000081 | 39,00 | 0,00 |
| 769 | 2.090 | 2023 | Factory | 303.245,000 | t Clinker fabricated | Marga | 0,000 | 0,000 | 399.456,000 | 0,000 | 0 | 399.456,00 | 1,317272 | 0,00 | 0,00 |
| 770 | 2.090 | 2023 | Factory | 303.245,000 | t Clinker fabricated | Limestone | 0,000 | 0,000 | 103.435,000 | 0,000 | 0 | 103.435,00 | 0,341094 | 0,00 | 0,00 |
| 771 | 2.090 | 2023 | Factory | 303.245,000 | t Clinker fabricated | Silica sand | 0,000 | 0,000 | 8.911,000 | 0,000 | 0 | 8.911,00 | 0,029385 | 0,00 | 0,00 |
| 772 | 2.090 | 2023 | Factory | 303.245,000 | t Clinker fabricated | Limonite | 0,000 | 0,000 | 6.505,000 | 0,000 | 0 | 6.505,00 | 0,021451 | 0,00 | 0,00 |
| 773 | 2.090 | 2024 | Factory | 304.012,000 | t Clinker fabricated | Marga | 0,000 | 0,000 | 439.370,000 | 0,000 | 0 | 439.370,00 | 1,445239 | 0,00 | 0,00 |
| 774 | 2.090 | 2024 | Factory | 304.012,000 | t Clinker fabricated | Limestone | 0,000 | 0,000 | 73.115,000 | 0,000 | 0 | 73.115,00 | 0,240500 | 0,00 | 0,00 |
| 775 | 2.090 | 2024 | Factory | 304.012,000 | t Clinker fabricated | Silica sand | 0,000 | 0,000 | 4.654,000 | 0,000 | 0 | 4.654,00 | 0,015309 | 0,00 | 0,00 |
| 776 | 2.090 | 2024 | Factory | 304.012,000 | t Clinker fabricated | Limonite | 0,000 | 0,000 | 2.488,000 | 0,000 | 0 | 2.488,00 | 0,008184 | 0,00 | 0,00 |
| 777 | 2.090 | 2025 | Factory | 330.927,000 | t Clinker fabricated | Marga | 0,000 | 0,000 | 488.041,000 | 0,000 | 0 | 488.041,00 | 1,474769 | 0,00 | 0,00 |
| 778 | 2.090 | 2025 | Factory | 330.927,000 | t Clinker fabricated | Limestone | 0,000 | 0,000 | 77.758,000 | 0,000 | 0 | 77.758,00 | 0,234970 | 0,00 | 0,00 |
| 779 | 2.090 | 2025 | Factory | 330.927,000 | t Clinker fabricated | Silica sand | 0,000 | 0,000 | 4.219,000 | 0,000 | 0 | 4.219,00 | 0,012749 | 0,00 | 0,00 |
| 780 | 2.090 | 2025 | Factory | 330.927,000 | t Clinker fabricated | Limonite | 0,000 | 0,000 | 645,000 | 0,000 | 0 | 645,00 | 0,001949 | 0,00 | 0,00 |
| 787 | 2.090 | 2023 | Factory | 397.511,000 | t Cement manufactured | Plaster | 0,000 | 0,000 | 15.714,000 | 0,000 | 0 | 15.714,00 | 0,039531 | 0,00 | 0,00 |
| 788 | 2.090 | 2023 | Factory | 397.511,000 | t Cement manufactured | Addition limestone | 0,000 | 0,000 | 41.969,000 | 0,000 | 0 | 41.969,00 | 0,105579 | 0,00 | 0,00 |
| 789 | 2.090 | 2024 | Factory | 436.485,000 | t Cement manufactured | Plaster | 0,000 | 0,000 | 18.359,000 | 0,000 | 0 | 18.359,00 | 0,042061 | 0,00 | 0,00 |
| 790 | 2.090 | 2024 | Factory | 436.485,000 | t Cement manufactured | Addition limestone | 0,000 | 0,000 | 50.574,000 | 0,000 | 0 | 50.574,00 | 0,115867 | 0,00 | 0,00 |
| 791 | 2.090 | 2025 | Factory | 480.744,000 | t Cement manufactured | Plaster | 0,000 | 0,000 | 21.065,000 | 0,000 | 0 | 21.065,00 | 0,043817 | 0,00 | 0,00 |
| 792 | 2.090 | 2025 | Factory | 480.744,000 | t Cement manufactured | Addition limestone | 0,000 | 0,000 | 58.479,000 | 0,000 | 0 | 58.479,00 | 0,121643 | 0,00 | 0,00 |
| 795 | 2.090 | 2023 | Factory | 303.245,000 | t Clinker fabricated | Steel slag | 100,000 | 0,000 | 3.089,000 | 0,000 | 0 | 3.089,00 | 0,010186 | 0,00 | 3.089,00 |
| 796 | 2.090 | 2023 | Factory | 303.245,000 | t Clinker fabricated | Foundry sand | 100,000 | 0,000 | 1.718,000 | 0,000 | 0 | 1.718,00 | 0,005665 | 0,00 | 1.718,00 |
| 797 | 2.090 | 2024 | Factory | 304.012,000 | t Clinker fabricated | Steel slag | 100,000 | 0,000 | 2.462,000 | 0,000 | 0 | 2.462,00 | 0,008098 | 0,00 | 2.462,00 |
| 798 | 2.090 | 2024 | Factory | 304.012,000 | t Clinker fabricated | Foundry sand | 100,000 | 0,000 | 1.658,000 | 0,000 | 0 | 1.658,00 | 0,005454 | 0,00 | 1.658,00 |
| 799 | 2.090 | 2025 | Factory | 330.927,000 | t Clinker fabricated | Steel slag | 100,000 | 0,000 | 2.537,000 | 0,000 | 0 | 2.537,00 | 0,007666 | 0,00 | 2.537,00 |
| 800 | 2.090 | 2025 | Factory | 330.927,000 | t Clinker fabricated | Foundry sand | 100,000 | 0,000 | 1.346,000 | 0,000 | 0 | 1.346,00 | 0,004067 | 0,00 | 1.346,00 |
| 804 | 2.090 | 2023 | Factory | 397.511,000 | t Cement manufactured | Fly ash from thermal power plants | 100,000 | 0,000 | 4.665,000 | 0,000 | 0 | 4.665,00 | 0,011736 | 0,00 | 4.665,00 |
| 805 | 2.090 | 2023 | Factory | 397.511,000 | t Cement manufactured | Ferrous sulfate | 100,000 | 0,000 | 758,000 | 0,000 | 0 | 758,00 | 0,001907 | 0,00 | 758,00 |
| 806 | 2.090 | 2023 | Factory | 397.511,000 | t Cement manufactured | Blast furnace slag | 100,000 | 0,000 | 1.668,000 | 0,000 | 0 | 1.668,00 | 0,004196 | 0,00 | 1.668,00 |
| 807 | 2.090 | 2024 | Factory | 436.485,000 | t Cement manufactured | Fly ash from thermal power plants | 100,000 | 0,000 | 3.646,000 | 0,000 | 0 | 3.646,00 | 0,008353 | 0,00 | 3.646,00 |
| 808 | 2.090 | 2024 | Factory | 436.485,000 | t Cement manufactured | Ferrous sulfate | 100,000 | 0,000 | 844,000 | 0,000 | 0 | 844,00 | 0,001934 | 0,00 | 844,00 |
| wdt_ID | Year | Center | Units | Type of Materials | |||||||||||
| ∑ = 11,564,782.000 |
 |
Biodiversity |
Biodiversity indicators
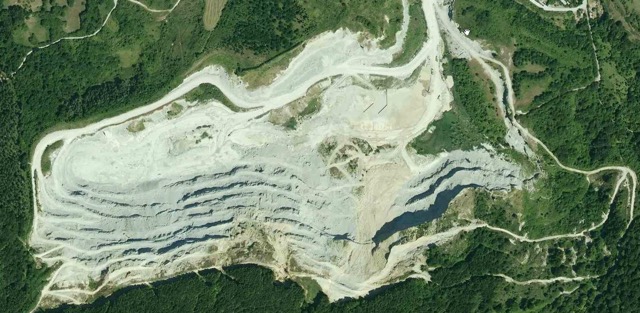
The primary impact of our operations on the landscape stems from the extraction of natural resources at quarries used to supply raw materials. The Group has identified the “development of integrated management criteria for quarry restoration and the promotion of biodiversity” as a key challenge for the future. The assessment of the impact on the landscape is conducted by comparing the area under exploitation to the area that has been restored. In a nutshell, the restoration process consists of filling in the mining pits on the already mined land, followed by the addition and spreading of topsoil. Herbaceous plants are then sown on top of this topsoil—either by broadcast seeding if weather conditions are suitable, or by hydroseeding—and finally, the entire area is planted with species suitable for the terrain, as shown in this sequence of images. The restoration was carried out in accordance with the plan for 2025.
| wdt_ID | userid | post_author | Year | Center | Units Pr. | Units | Total land use (m2) | Sealed surface area (m²) | Unsealed area (m2) | Land use / nature | Area oriented according to nature at the site (m²) | Non-central area oriented according to nature (m²) | Usage ratio (m2)/Udp. | Sealed ratio (m2)/Udp. | Unsealed Ratio (m2/Udp) | Targeted ratio (m2)/Udp. | Off-center ratio (m2)/Udp. |
|---|---|---|---|---|---|---|---|---|---|---|---|---|---|---|---|---|---|
| 146 | 2.090 | 2.090 | 2023 | Factory | 312.037,000 | Tn product manufactured | 118.819 | -118.819 | 0,0000 | 0,3808 | -0,3808 | 0,0000 | 0,0000 | ||||
| 147 | 2.090 | 2.090 | 2024 | Factory | 436.485,000 | Tn product manufactured | 118.819 | -118.819 | 0,0000 | 0,2722 | -0,2722 | 0,0000 | 0,0000 | ||||
| 149 | 2.090 | 2.090 | 2023 | Quarry | 399.456,000 | Marl production | 782.100 | 782.100 | 1,9579 | 0,0000 | 1,9579 | 0,0000 | 0,0000 | ||||
| 150 | 2.090 | 2.090 | 2024 | Quarry | 439.370,000 | Marl production | 782.100 | 782.100 | 1,7800 | 0,0000 | 1,7800 | 0,0000 | 0,0000 | ||||
| 152 | 2.090 | 2.090 | 2023 | Factory and Quarry | 312.037,000 | Tn product manufactured | 900.919 | 118.819 | 764.795 | 17.305 | 2,8872 | 0,3808 | 2,4510 | 0,0555 | 0,0000 | ||
| 153 | 2.090 | 2.090 | 2024 | Factory and Quarry | 436.485,000 | Tn product manufactured | 900.919 | 118.819 | 764.795 | 17.305 | 2,0640 | 0,2722 | 1,7522 | 0,0396 | 0,0000 | ||
| 187 | 2.090 | 2.090 | 2025 | Factory | 480.744,000 | Tn product manufactured | 118.819 | -118.819 | 0,0000 | 0,2472 | -0,2472 | 0,0000 | 0,0000 | ||||
| 188 | 2.090 | 2.090 | 2025 | Quarry | 480.744,000 | Marl production | 782.100 | 782.100 | 1,6269 | 0,0000 | 1,6269 | 0,0000 | 0,0000 | ||||
| 189 | 2.090 | 2.090 | 2025 | Factory and Quarry | 480.744,000 | Tn product manufactured | 900.919 | 118.819 | 764.795 | 17.305 | 1,8740 | 0,2472 | 1,5909 | 0,0360 | 0,0000 | ||
| Year | Center | ||||||||||||||||
| ∑ = 3,778,102.000 |
 |
Other information of environmental interest |
Indicators and impacts
The progress in environmental performance at the Olazagutía plant is tracked—as at all other plants of Grupo Cementos Portland Valderrivas—by measuring a series of basic environmental performance and management indicators, as no sector-specific reference documents or activity-type-specific indicators have been published to date; these will be adopted upon their future publication in accordance with the new EMAS III Regulation.
 |
Environmental aspects and impacts |
Environmental aspects and impacts
The identification of environmental aspects is based on an analysis of the processes, facilities, and products at the factory and quarry, with a focus on the life cycle of the manufactured products. This objective and quantitative identification takes into account potential interactions with the environment—soil, water, the atmosphere, the natural environment, the socioeconomic environment, the population, etc. —as well as normal and abnormal operating and functioning conditions, potential accidents or emergencies, indirectly generated impacts, and those that may arise from past and future activities, recognizing the importance of adopting preventive measures from the very outset of our actions.
Description of the most important and significant environmental aspects
The annual assessment of environmental aspects is generally based on a set of definitive environmental criteria, as indicated below.
- Hazard or level of environmental impact of the aspect.
- Quantity or volume of the environmental aspect.
- Complaints received from stakeholders.
- Severity or level of severity of the impact, generally associated with the intrinsic and objective hazard.
- Probability, frequency or recurrence with which the aspect occurs.
- Capacity to influence economic, technical or human resources to carry out actions for prevention, control and correction of the aspect.
The assessment of environmental aspects serves as a starting point for reviewing the system and for defining and updating operational control procedures, as well as procedures for responding to potential accidents and emergency situations.
Based on the identified issues, each one is evaluated according to risk criteria—based on how close they are to the threshold value or the Group’s target values, the quantity relative to the previous year, and any complaints or legal violations that have occurred.
Significance (standard) = risk level × quantity × complaints and non-compliance ≥ 10
Significance (abnormal) = number of complaints and non-compliance incidents ≥ 5
Significance (urgency) = probability × severity × complaints and non-compliance ≥ 10
Direct environmental aspects are those generated as a result of the activities of the factory and quarry over which there is full control of their management. Grouped according to their environmental vector, the following environmental aspects have been identified and evaluated under normal and abnormal conditions.
Indirect environmental aspects are those aspects derived from the factory's activities, products and services over which there is no full control of their management. The following have been identified and evaluated as environmental aspects to be taken into account:
- Greenhouse gas emissions as a result of the transportation of purchased products.
- Greenhouse gas emissions from electricity consumption.
- Packaging waste placed on the market once it has been used.
|
ASPECT |
IMPACT |
|
Confined and diffuse atmospheric emissions |
Acid rain Photochemical smog, effects on fauna and flora and nuisance to the population |
|
CO2emissions |
Global warming |
|
Power consumption |
Depletion of natural resources |
|
Water consumption |
Depletion of natural resources |
|
Fuel consumption, raw materials and additives |
Natural resource depletion and global warming |
|
Consumption of auxiliary materials |
Depletion of natural resources |
|
Waste generation |
Use of natural resources and land occupation |
|
Sound emission |
Disturbance to the population and wildlife |
|
Water discharges |
Deterioration in water quality |
|
Exploitation of natural resources |
Deterioration of the landscape and increase in visual impact |
|
Land occupation |
Landscape disturbance and soil and groundwater contamination |
At the same time, identification criteria are applied to environmental aspects in emergency situations, based on the potential environmental emergencies identified during the process through a Technical Instruction incorporated into the Environmental Management System.
The assessment is based on probability criteria—such as the frequency of occurrence, severity relative to the environment’s capacity to recover, and complaints received or legal violations.
Based on the assessment conducted, significant environmental aspects are those with the greatest impact and which, therefore, receive the highest scores according to the specified criteria. Thus, using the new assessment methodology defined, the following environmental aspects were identified as significant in 2025, for which a series of improvement actions have been established—in some cases as part of the environmental program set forth for the upcoming period. See the table of Significant Environmental Aspects.
Environmental emergencies
Real environmental emergencies and environmental drills allow us to evaluate and update the implementation of the Emergency Plans designed for the factory and quarry by the Occupational Risk Prevention Department and the environmental accident management procedures defined within the Environmental Management System. These plans cover different emergency scenarios, action plans for each of them, and the teams responsible for their implementation.
During 2025, there were no actual emergency situations at the facilities that led to the activation of the emergency plan and that had environmental implications.
UNLOADING OF HAZARDOUS MATERIALS
The unloading of dangerous goods is carried out in accordance with the International Agreement on the Transport of Dangerous Goods by Road (ADR). We have a Safety Advisor and submit an annual report to the competent authorities.
Description of significant environmental aspects
| wdt_ID | state | userid | Year | Center | Life Cycle Phase | Environmental Aspect | Impact | Typology | Process | udimpact | Actions | Analysis | Significant | ID | post_author |
|---|---|---|---|---|---|---|---|---|---|---|---|---|---|---|---|
| 1.340 | VALIDATED | 2.090 | 2024 | Factory | Production | Atmospheric emissions in furnaces. NH3 emissions from Furnace 8 | AIR POLLUTION | Direct | Limestone decarbonation | 10 | Yes | 138.995 | 2.090 | ||
| 1.341 | VALIDATED | 2.090 | 2024 | Factory | Production | Consumption of fuels, raw materials, and additives Consumption of raw materials incorporated into clinker | RESOURCE DEPLETION | Direct | Limestone decarbonation | 10 | Yes | 138.995 | 2.090 | ||
| 1.342 | VALIDATED | 2.090 | 2024 | Factory | Production | Consumption of fuels, raw materials, and additives Consumption of additives incorporated into cement | RESOURCE DEPLETION | Direct | Limestone decarbonation | 10 | Yes | 138.995 | 2.090 | ||
| 1.343 | VALIDATED | 2.090 | 2024 | Factory | Production | Alternative fuel consumption/CO2 emissions Energy substitution rate (percentage) CO2 emissions from clinker kilns | RESOURCE DEPLETION, CLIMATE CHANGE | Direct | Limestone decarbonation | 10 | Yes | 138.995 | 2.090 | ||
| 1.344 | VALIDATED | 2.090 | 2024 | Factory | Production | Generation of Hazardous waste. Refractory brick | DEPLETION OF RESOURCES, CLIMATE CHANGE, GENERATION OF Hazardous WASTE | Direct | Limestone decarbonation | 10 | Yes | 138.995 | 2.090 | ||
| 1.345 | VALIDATED | 2.090 | 2024 | Factory | Production | Total generation of Hazardous waste (RNP) | DEPLETION OF RESOURCES, CLIMATE CHANGE, GENERATION OF Hazardous WASTE | Direct | Limestone decarbonation | 10 | Yes | 138.995 | 2.090 | ||
| 1.346 | VALIDATED | 2.090 | 2024 | Quarry | Production | Wastewater discharges Discharge of MES into quarry | WATER DISTURBANCE | Direct | Raw material collection | 10 | Yes | 138.995 | 2.090 | ||
| 1.484 | VALIDATED | 2.090 | 2025 | Factory | Production | Atmospheric emissions in furnaces. NH3 emissions from Furnace 8 | AIR POLLUTION | Direct | Limestone decarbonation | 10 | This is significant because the NOx emission limit value (ELV) is very low, at 350 mg/Nm³, and in order to meet it, a large amount of ammonia water must be injected. Part of it does not react with the NOx, resulting in the emission of NH₃. The improvement measures already outlined in an action plan consist of making NOx abatement through the injection of ammonia water more efficient, as well as requesting a new emission limit value from the authorities. | Yes | 138.995 | 2.090 | |
| 1.485 | VALIDATED | 2.090 | 2025 | Factory | Production | Consumption of fuels, raw materials, and additives Consumption of raw materials incorporated into clinker | RESOURCE DEPLETION | Direct | Limestone decarbonation | 10 | This is significant because the proposed benchmark is a 5% substitution rate, compared to 1.17% in 2025—a figure that has also decreased from 1.36% in 2024. The challenges in achieving the benchmarking target stem from the economic situation in other sectors and the inability to secure sufficient raw materials suitable for the process at that substitution rate. |
Yes | 138.995 | 2.090 | |
| 1.486 | VALIDATED | 2.090 | 2025 | Factory | Production | Consumption of fuels, raw materials, and additives Consumption of additives incorporated into cement | RESOURCE DEPLETION | Direct | Limestone decarbonation | 10 | It is significant that the proposed benchmarking target is a 15% substitution rate, compared to 0.26% in 2025. Furthermore, it has decreased compared to 2025 (0.26% vs. 1.03%). The difficulties in achieving the benchmarking target stem from the economic situation in other sectors and the impossibility of increasing the substitution rate by that percentage. |
Yes | 138.995 | 2.090 | |
| 1.487 | VALIDATED | 2.090 | 2025 | Factory | Production | CO2 Emissions. CO2 Emissions from Clinker Kilns | RESOURCE DEPLETION, CLIMATE CHANGE | Direct | Limestone decarbonation | 10 | It remains significant. Although progress has been made—with an energy substitution rate of 1.79%—it has not been enough to bring the ratio in line with the benchmark (864.7 in 2025 vs. 766) Development continued in 2025 with the biomass trial, and authorization for biomass Recovery was obtained. |
Yes | 138.995 | 2.090 | |
| 1.488 | VALIDATED | 2.090 | 2025 | Factory | Production | Consumption of: Heating oil. Consumption of explosives for quarry blasting. | RESOURCE DEPLETION | Direct | Procurement of raw materials | 10 | This is significant because diesel consumption has increased substantially compared to 2024, both in absolute and relative terms. As for explosives consumption, it has also increased and is among the highest in the data series under consideration. |
Yes | 138.995 | 2.090 | |
| 1.489 | VALIDATED | 2.090 | 2025 | Factory | Production | Hazardous waste generation. Refractory bricks, electronic waste, wood | RESOURCE DEPLETION, CLIMATE CHANGE | Direct | Production | 10 | There has been a significant increase in specific cases, due to a major shift in brick production and management within a single year. A similar trend has occurred with electronic waste and wood, though not as extreme as with brick. Since these are recoverable materials, it is not as problematic. |
Yes | 138.995 | 2.090 | |
| 1.490 | VALIDATED | 2.090 | 2025 | Factory | Production | Hazardous Waste Generation. Safety-Kleen Oily Sludge | RESOURCE DEPLETION, CLIMATE CHANGE | Direct | Production | 10 | The increases are not significant compared to last year, but they are sufficient and fall within the maximum benchmarking range. As for Safety Kleen, it is a recoverable waste, so it is not a problem. As for the oily sludge from the oil/grease separator, it is no longer a recyclable waste, although its generation depends on usage, as well as any carryover that may contribute to it. |
Yes | 138.995 | 2.090 | |
| 1.491 | VALIDATED | 2.090 | 2025 | Factory | Production | Total generation of Hazardous waste (RNP) | RESOURCE DEPLETION, CLIMATE CHANGE | Direct | Production | 10 | This is significant because it has increased substantially compared to 2043, both in absolute terms and relative to the unit of product manufactured. This is primarily due to the production of refractory bricks in 2025, whose density results in considerable weight, and, to a lesser extent, scrap metal. Since the cause is waste that is recycled, it is not as problematic. |
Yes | 138.995 | 2.090 | |
| 1.492 | VALIDATED | 2.090 | 2025 | Factory | Production | Wastewater discharges. Discharge of sludge into a quarry | WATER DISTURBANCE | Direct | Production | 10 | Occasional exceedances of suspended solids limits at the quarry during periods of heavy rainfall. The situation will be analyzed, and a new plan to upgrade the discharge system has been developed, as the corrective measures implemented were insufficient for periods of heavy rainfall. |
Yes | 138.995 | 2.090 | |
 |
Environmental improvement planning |
Target Planning
The environmental program is the tool used to minimize environmental impacts as much as possible, starting with the most significant ones. It is developed based on the basic principles established in the Environmental Policy and is updated annually. GUIDELINES TO CONSIDER WHEN UPDATING THE PROGRAM The environmental program is the tool used to minimize environmental impacts as much as possible, starting with the most significant ones. It is developed based on the basic principles established in the Environmental and Energy Policy and is updated annually. For planning, we take into account the results of the assessment of aspects, risks, and opportunities, legal requirements, non-conformities and incidents, the opinion of stakeholders, and technological options for implementing opportunities for improvement.
Environmental improvement planning
The following is a summary of the achievement of the objectives and targets of the Environmental Program implemented in 2025, with regard to its environmental aspects.
Two of the five objectives established in the Environmental Program have been fully achieved. For the remaining objectives, various targets have been met, but the specific indicator associated with each objective has not been strictly met. Progress toward these objectives has been monitored through meetings of the plant-level Environmental Committees and the Environmental Committees of the Spain Cement Business Unit, which are held at the corporate level.
Similarly, the 2025 Environmental Program is based on a previous assessment of various aspects related to the facility’s activities in 2024.
The Environmental Program for 2026 will focus on continuing to work toward the three unmet objectives, as well as those identified through the assessment of environmental issues. The following objectives are established to address the improvement of natural resource use and climate change.
The planned improvement goals are listed below (Jan. 2025 – Dec 2025)
| userid | wdt_ID | Year | Center | Life Cycle Phase | Objective | Goal / Action | Impact/Associated Impact | Target Value | Value reached | % Achieved | Department / Resource | Deadline | Remarks | post_author |
|---|---|---|---|---|---|---|---|---|---|---|---|---|---|---|
| 2.090 | 441 | 2025 | Factory | PRODUCTION | 2. Improving the efficiency of Furnace 8 to reduce energy consumption by at least 3% per ton of coke produced | 2.1 Establishment of the Working Group 2.2 Study of options for action aimed at increasing efficiency on the Furnace 8 line 2.3 Implementation of efficiency measures 2.4 Monitoring the implementation and effectiveness of the measures |
Depletion of resources / ENERGY CONSUMPTION | 3,000 | 2,000 | 75,0 | Maintenance / Environment Dept. | 31/12/2025 | Target not met | 2.090 |
| 2.090 | 442 | 2025 | Factory | PRODUCTION | 1. Improve the electrical efficiency of Furnace 8 to reduce energy consumption by at least 3% per ton of ck produced | 1.1 Establishment of the Working Group 1.2 Study of options for action aimed at increasing efficiency 1.3 Implementation of efficiency measures 1.4 Monitoring the implementation and effectiveness of the measures |
Depletion of resources / ELECTRICITY CONSUMPTION | 3,000 | 1,500 | 50,0 | Maintenance / Environment Dept. | 31/12/2025 | Target not met | 2.090 |
| 2.090 | 443 | 2025 | Factory | PRODUCTION | 3. Improving internal waste management at the factory by implementing 100% of the improvements approved by management | 3.1 Study of internal waste management, particularly regarding recycling centers and workshop areas 3.2 Implementation of approved proposals. 3.3 Monitoring of implementation |
Depletion of resources / WASTE GENERATION | 100,000 | 25,000 | 25,0 | Maintenance / Environment Dept. | 31/12/2025 | Target not met | 2.090 |
| 2.090 | 444 | 2025 | Factory | PRODUCTION | 4. Reduce the specific CO2 emission rate from the kiln by 1 per ton of clinker. | 4.1 Study and implementation of the process with regard to thermal efficiency based on fuel consumption, particularly petcoke 4.2 Use of decarbonized secondary raw materials, and/or study of biomass utilization 4.3 Conclusions |
Climate change / CO2 emissions | 1,000 | 1,000 | 100,0 | Maintenance / Environment Dept. | 31/12/2025 | Goal achieved | 2.090 |
| 2.090 | 558 | 2025 | Factory | PRODUCTION | 5. Improving the energy efficiency of various systems and equipment, such as motors, compressors, and cement conveyors | 5.1 Establishment of the Working Group 5.2 Analysis of Action Options for Various Facilities 5.3 Implementation of Efficiency Measures 5.4 Monitoring the Implementation and Effectiveness of the Measures |
Total electricity consumption | 1,000 | 1,000 | 100,0 | Maintenance / Environment Dept. | 31/12/2025 | Goal achieved | 2.090 |
| 2.090 | 559 | 2026 | Factory | PRODUCTION | 1. Power consumption of the oven 8 | 1.1 Establishment of the Working Group. 1.2 Study of options for improving electrical efficiency in the Furnace 8 line. 1.3 Implementation of selected efficiency measures. 1.4 Monitoring of the implementation and effectiveness of the measures. |
Climate Change / CO2 Emissions / Depletion of Resources | 1,000 | 0,000 | 0,0 | Head of Maintenance / Environmental Department | December 31, 2026 | 1.1 Expected deadline: May 2026 1.2 Expected deadline: May 2026 1.3 Expected deadline: Dec 2026 1.4 Expected deadline: Dec 2026 |
2.090 |
| 2.090 | 560 | 2026 | Factory | PRODUCTION | 2. A reduction of at least 1% in energy consumption per ton of clinker produced compared to the base year. | 2.1 Establishment of the Working Group. 2.2 Study of options for improving thermal efficiency in Furnace Line 8. 2.3 Implementation of selected efficiency measures. 2.4 Monitoring of the implementation and effectiveness of the measures. |
Climate Change / CO2 Emissions / Depletion of Resources | 1,000 | 0,000 | 0,0 | Head of Maintenance / Environmental Department | December 31, 2026 | 2.1 Expected deadline May 2026 2.2 Expected deadline June 2026 2.3 Expected deadline Dec 2026 2.4 Expected deadline Dec 2026 |
2.090 |
| 2.090 | 561 | 2026 | Factory | PRODUCTION | 3. 100% of the improvements approved by management have been implemented | 3.1 Study of internal waste management, particularly with regard to recycling centers and workshop areas. 3.2 Implementation of the approved proposals. 3.3 Monitoring of implementation. |
Waste generation | 100,000 | 0,000 | 0,0 | Department of the Environment | December 31, 2026 | 3.1 Expected deadline: May 2026 3.2 Expected deadline: Dec 2026 3.3 Expected deadline: Dec 2026 |
2.090 |
| 2.090 | 562 | 2026 | Factory | PRODUCTION | 4. Reduce CO2 emissions by 0.5% per ton of clinker by 2025. | 4.1 Study and implementation of the process with regard to thermal efficiency based on fuel consumption, particularly petcoke. 4.2 Use of decarbonized secondary raw materials, and/or study of biomass utilization. 4.3 Conclusions. |
CO2 emissions | 0,500 | 0,000 | 0,0 | Production Manager / Quality Manager / Environmental Manager | December 31, 2026 | 4.1 Expected deadline: Dec. 26 4.2 Expected deadline: Dec. 26 4.3 Expected deadline: Dec. 26 |
2.090 |
| 2.090 | 563 | 2026 | Factory | PRODUCTION | 5. A reduction of at least 1% in electricity consumption per unit produced at the facility where the measure is implemented. | 5.1 Establishment of the Working Group. 5.2 Assessment and selection of facilities and equipment suitable for improvement, such as engines, compressors, or cement transport systems. 5.3 Implementation of selected efficiency measures. 5.4 Monitoring of the implementation and effectiveness of the measures. |
Electricity consumption. | 1,000 | 0,000 | 0,0 | Head of Maintenance / Plant Management | December 31, 2026 | 5.1 Expected deadline: May 2026 5.2 Expected deadline: May 2026 5.3 Expected deadline: Dec 2026 5.4 Expected deadline: Dec 2026 |
2.090 |
| userid | wdt_ID | Year | Center | Life Cycle Phase | Impact/Associated Impact | post_author |
 |
Legal compliance analysis |
Legal and regulatory compliance
The organization has a procedure and system for the identification of legal requirements, as well as for periodic evaluation to ensure full compliance. The following is a list of current environmental permits and/or authorizations, as well as a summary of their validity.
The activities carried out by the Olazagutía factory are conducted in accordance with current European, national, regional, and local environmental regulations and the specific requirements of each facility. Legal compliance is assessed periodically and procedurally, requirement by applicable requirement.
List of permits, authorizations and declarations in force
In addition to the provisions regarding the AAI and GHG Emission Authorization, the most significant legislative changes introduced in 2025 and incorporated into the requirements governing cement manufacturing and quarry operations are as follows:
- Regulation 2025/40 of December 19, 2024, on packaging and packaging waste, amending Regulation (EU) 2019/1020 and Directive (EU) 2019/904 and repealing Directive 94/62/EC
- CBAM – Various European Regulations on the Carbon Border Adjustment Mechanism.
- Royal Decree 214/2025, of March 18, creating the registry of carbon footprint, offsetting and carbon dioxide absorption projects and establishing the obligation to calculate the carbon footprint and the preparation and publication of greenhouse gas emission reduction plans.
- ROYAL DECREE 712/2025, of August 26, on end-of-life tires.
- Resolution 362E/2025, dated September 9, issued by the Director of the Circular Economy and Innovation Service, authorizing the project for Recovery from biomass waste—specifically olive pomace— at a maximum capacity of 26,433 metric tons per year, as well as forestry materials in a maximum quantity of 6,077 metric tons per year, and coffee grounds, 10,367 metric tons per year, although the latter are not considered waste.
- Resolution 84 E/2025, dated March 7, issued by the Director of the Circular Economy and Innovation Service, approving an industrial trial to incorporate olive pomace waste as biomass fuel, up to 3,000 metric tons, in order to conduct a study on the atmospheric dispersion of pollutants.
Regulatory Compliance Summary
There are several significant legislative developments at the regional, national, or European level that emerged in 2025 and have, for the most part, been incorporated into the requirements governing cement manufacturing and quarry operations. Notable among these are:
Statement of compliance with legislation
"We hereby declare, on the part of our organization, compliance with environmental legislation and permit conditions during the period indicated and at the sites included in this Environmental Statement."
During fiscal year 2025, the various activities were carried out in accordance with current environmental regulations, as well as all specific requirements applicable to each activity. There were no regulatory violations that resulted in final penalty decisions.
An annual assessment of environmental legal compliance is carried out with the participation of the Legal Advisory Department, with satisfactory results.
Thus, in 2025, following the inspection and analysis conducted, the Olazagutía Plant of Grupo Cementos Portland Valderrivas concluded that the applicable environmental legal requirements had been met.
As of the date of publication of this Environmental Statement, the Sectoral Reference Document (SRD) applicable to the cement sector has not yet been published. Once it is published, it will be taken into account in order to update the content of the Environmental Statement.
|
Good environmental management practices |
Ecodesign and life cycle analysis
Life Cycle Assessment (LCA) of a product, process, or technology is a methodology that seeks to identify, quantify, and characterize the various potential environmental impacts associated with each stage of a product’s life cycle. LCA provides valuable information that enables the industry and users to make decisions aimed at improving the environmental performance of processes and products.
The cement industry, as a sector sensitive to sustainable development, has conducted a cross-sector life cycle assessment through AENOR’s EDP Global Program, which has resulted in the creation of environmental product declarations (EPDs).
A panel of experts, which included a representative from Cementos Portland Valderrivas, S.A., developed Product Category Rule 003 “Cements,” taking into account, among others, the standards UNE-EN ISO 14040 Environmental management. Life cycle assessment. Principles and framework,” and UNE-EN ISO 14044 “Environmental management. Life cycle assessment. Requirements and guidelines.”
Thus, the cement industry evaluates its impact, manages the use of different types of waste as raw materials or fuels, controls the destination of packaging, and monitors its process in search of the best environmental performance.
ENVIRONMENTAL PRODUCT DECLARATIONS
Best practices in environmental management
Best Environmental Management Practices
Integration with SDG of Agenda 2030


Following the adoption of the Agenda 2030 commitments, the Group has continued to work on a business model for sustainable development. To this end, various actions have been developed in favor of people, the planet and progress, allowing us to gradually align ourselves with the Sustainable Development GoalsSDG). There are 4 SDG to which the CPV Group contributes most significantly throughout its value chain: 9, 11, 12 and 13.
|
To ensure healthy living and promote wellness for all at all ages.
We promote the safety, health and well-being of our employees and collaborators, integrating safety in all our operations. We have ZERO tolerance when it comes to safety. We do not admit shortcuts. |
|
Ensure inclusive and equitable quality education and promote lifelong learning opportunities for all.
We promote the development of our employees and collaborators, offering them inclusive, equitable and quality training and promoting ESG education among our stakeholders. |
|
Achieving gender equality and empowering all women and girls.
We work to promote gender equality among our professionals, so that everyone has equal access to working conditions and rights, training, promotion and remuneration. |
|
Ensure availability and sustainable management of water and sanitation for all.
We responsibly manage water consumption at our facilities through automation, controlling leaks and reusing wastewater from other companies for cooling gas conditioning equipment prior to filtration, as well as to reduce diffuse emissions in the quarry. |
|
Ensure access to affordable, reliable, sustainable and modern energy for all.
The Group is working on cross-sector collaboration projects to increase the mix of renewable energies in the plants, from future wind farms or solar photovoltaic technology plants. We incorporate biomass fuels in our process, replacing fossil fuels. |
|
Promote sustained, inclusive and sustainable economic growth, full and productive employment and decent work for all.
The Cement business generates a positive impact on employment and on the development of the communities in which we operate, with a high percentage of direct and indirect local hires. |
|
Building resilient infrastructure, promoting inclusive and sustainable industrialization and fostering innovation.
The Group collaborates and develops R&D&I projects that enable us to manufacture reliable, sustainable, resilient and quality construction products that facilitate the economic and social development of a country, using resources more efficiently and promoting the adoption of technologies, research and innovation. |
|
Making cities and human settlements inclusive, safe, resilient and sustainable.
The cement sector plays a fundamental role in the construction of more sustainable buildings and infrastructure, and the Group is constantly searching for solutions to reduce environmental impact and make them more resilient to risks such as climate change. |
|
Ensure sustainable consumption and production patterns.
The Group follows the basic principles of the circular economy, implementing strategies for Recovery and material Recovery from waste, with the aim of improving our production conditions while fully ensuring the success and sustainability of our processes. |
|
Take urgent action to combat climate change and its effects.
The Group, committed to current European Union and Spanish environmental policies, assumes the fight against climate change as a strategic challenge and develops, based on sectorial strategic lines, actions to achieve climate neutrality in 2050 within the framework of its capacity to act. Emphasis is placed on reducing CO2 emissions, increasing energy efficiency, increasing efficiency in the use of natural resources, energy recovery from waste and increasing the substitution of clinker for additions. |
|
Protect, restore and promote the sustainable use of terrestrial ecosystems, sustainably manage forests, combat desertification, halt and reverse land degradation and halt biodiversity loss.
We rehabilitate our quarries, creating habitats that favor the reestablishment of fauna and flora, and we even improve them, providing refuge for some protected species. We share the knowledge we acquire with specialized stakeholders. |
|
Promote peaceful and inclusive societies for sustainable development, facilitate access to justice for all, and build effective, accountable and inclusive institutions at all levels.
We keep our compliance manual updated, ensuring that all members are aligned with the ethical and integrity principles established in our code of ethics and conduct, the pillar of our culture, values and principles by which the Group is governed. We train our employees in ethics and anti-corruption, in order to build a solid organization where corruption and human rights violations are not tolerated. |
|
Strengthen the means of implementation and revitalize the Global Partnership for Sustainable Development.
Following the adoption of the Agenda 2030 commitments, the Group has continued to work on a business model for sustainable development. To this end, various actions have been developed in favor of people, the planet and progress, allowing us to gradually align ourselves with the Sustainable Development GoalsSDG). There are 4 SDG to which the CPV Group contributes most significantly throughout its value chain: 9, 11, 12 and 13.
|
◉ Verification record
This Digital Environmental Statement has been verified by:
– AENOR
The document with the highest validity—or, in the event of discrepancies—shall be the PDF digitally signed by the verifying body. This document is an accurate representation and printout of this Digital Environmental Declaration or rendered web page. Interested parties may download this rendered version here as a sample and proof of the consistency and integrity of the data validated in this DIGITAL ENVIRONMENTAL DECLARATION. Environmental-Declaration-Olazagutia-2025-and-Annex-VII.pdf
Date of lastupdate: – Render Version File No.: 0
ORGANIZATION: GRUPO CEMENTOS PORTLAND VALDERRIVAS – CENTER(S) – COVERAGE: OLAZAGUTÍA FACTORY
ACCESS TO THE EUROPEAN REGISTRY: EUROPEAN COMMISSION
TRANSLATIONS OF THIS ENVIRONMENTAL STATEMENT: This EMAS Environmental Statement has been verified in its original language. The browsers used by stakeholders for consultation, or the Platform RightSupply itself, may automatically translate its direct transcription, without the certifying body considering its translated content as validated a priori. Methods such as sworn translation are recommended for this purpose.
EXTERNAL LINKS AND AUDIOVISUAL CONTENT: This EMAS Environmental Statement has been verified in its entirety, with the exception of external links and audiovisual or videographic content that may have been included for complementary purposes.
DIGITALIZATION: Digitization of environmental statements is a best practice with multiple sustainability benefits. By eliminating the use of paper, a significant reduction in energy and water consumption is achieved, which in turn minimizes the carbon footprint. This digital transition not only supports the environment, but also improves data accuracy and consistency, optimizing management efficiency, environmental reporting and access to information for stakeholders. This initiative was recognized as a best practice in 2022 within the European Union's INTERREG EUROPE public policy program (ENHANCE EMAS), underlining its importance in promoting a greener and more efficient administration across Europe.
CO₂ eq:stands forcarbon dioxide equivalent. It is used to measure the impact of different greenhouse gases on global warming by converting emissions of these gases into the equivalent amount of carbon dioxide (CO₂) that would produce the same effect.
EMAS: Eco-Management and AuditScheme. It is a voluntary environmental management system developed by the European Union for organizations that wish to assess, manage, and improve their environmental performance.
GJ:Unitof energy. A gigajoule is a unit of energy measurement, equivalent to one billion joules (J).
LPG: Liquefied PetroleumGas. It is a mixture of gaseous hydrocarbons, primarily propane and butane, which are liquefied to facilitate storage and transport.
GN: NaturalGas.
ISO: International Organization for Standardization. It is an entity that develops international standards for various products, services and management systems.
kt:Unitof mass equal to 1,000 tons.
MWh:Unitof energy in megawatt-hours
NACE: is a standard that allows the classification of the different economic activities carried out in the EU, facilitating the comparison of data between countries and the preparation of homogeneous statistics.
PPA:PowerPurchase Agreement. This is a long-term contract between an energy buyer and a renewable energy producer that sets forth the terms and conditions for the sale and purchase of electricity.
S1: Scope 1 for CO2eq emissions.
S2:Scope2 for CO2eq emissions.
S3:Scope3 for CO2eq emissions.
Units:Unit. Units concentration: Unit of concentration.
Units : Productionunit.
UNE:standsfor the Spanish Association for Standardization. It is the body responsible for developing technical standards in Spain, acting as the national standardization body. UNE promotes quality, safety, and efficiency in products and services through the development and dissemination of standards.
∑ (uppercase sigma):usedin mathematics to represent the sum of a series of terms.
Template: 2026 Final