








Environmental Statement
EMAS STATEMENT REPORTING PLATFORM

Environmental Statement
EMAS EUROPEAN REGULATIONS


Environmental Statement
EMAS STATEMENT REPORTING PLATFORM
Annex IV.B Environmental statement
- A summary of the organisation's activities, products and services, the organisation's relationship to central organisations, if applicable, and a clear and unambiguous description of the scope of the EMAS registration, including a list of the sites included in this registration;
 |
General data |
Introductory Presentation
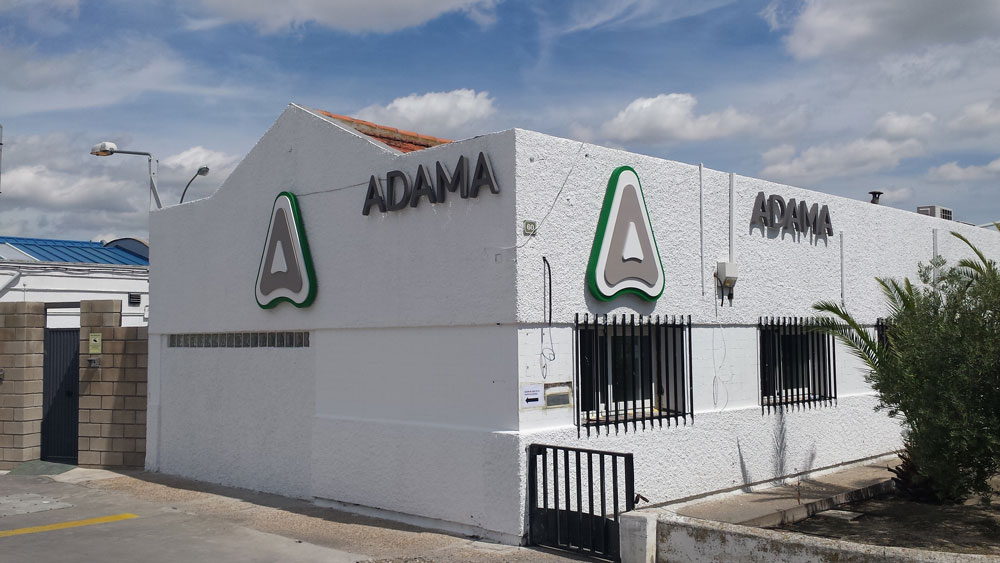
ADAMA AGRICULTURE ESPAÑA (hereinafter ADAMA) is dedicated to the industrial formulation (preparation of mixtures) and wholesale distribution of plant protection products designed to protect crops and harvests from the various pests and diseases that can attack them, ultimately providing products for plant health. At ADAMA, we have been carrying out our activity for more than 40 years, initially as the Agrochemical Division of the company Energía e Industrias Aragonesas (known by the acronym EIASA) and, since 1993, under the name Aragonesas Agro (ARAGRO) as an independent entity, first until 1997 as a subsidiary of the EIASA Group and, from that date until the present, as a subsidiary of the international Makhteshim Agan Group (located in Israel, Latin America, Europe, the US, and APAC).
In recent years, Makhteshim Agan has been working on a transition process towards a single global brand, which emerged in 2014 as ADAMA, a Hebrew word meaning "earth." In Spain, since November 2014, it has adopted the name Adama Agriculture España, S.A. We are passionate about agriculture and see what we do as much more than just a job. Our simple and practical approach helps us focus on what matters most to us: helping our customers create more sustainable and profitable businesses.
 |
2024 |
Humanes Factory + Madrid Offices
 Centre/s
2
 Workers
68
 Surface area
25,245.61 m²
24,430 m² Fab + 815.61 m² Of
 Activity in
Tons produced
10.383
Our organisation presents this validated Environmental Statement as part of our commitment to transparency and environmental improvement of our activities, operations and facilities.
LOCATION- MAIN CENTER
|
Description of the activity |
Activities and scope of the Environmental Statement
The activity carried out at the facilities is the formulation (mixing) of phytosanitary products and other agrochemical products and their packaging. Within the facilities, raw materials are mixed and dissolved, both in liquid and solid form, using water and various solvents to obtain final products in liquid form and excipients. Under no circumstances are chemical transformations carried out, nor are solid substances packaged. Once the mixture has been made, it is then packaged, palletized, and sent to the appropriate storage warehouses. After a maximum of 72 hours of storage at our facilities, the formulated products are sent to external logistics operators, who deliver them to the end users of our products, or directly to the customer from the facility.


Our organisation presents this validated Environmental Statement as part of our commitment to transparency and environmental improvement of our activities, operations and facilities.
|
Environmental management and governance approach |
Description of the Environmental Management System
In 2002, ADAMA certified its quality assurance system in accordance with ISO 9001:2000. In 2006, in line with the principle of continuous improvement, it developed and implemented an environmental management system in accordance with ISO 14001:2004 and EC Regulation No. 761/01 EMAS II. Due to the failure to adequately maintain the system in accordance with the EMAS III Regulation (Regulation (EC) 1221/2009), in 2015, the organization proceeded to cancel the ESMMD000329 registration in EMAS in the first quarter of 2016 (a registration that had been renewed in 2013). Finally, in December 2016, a new application for registration was submitted, which was approved in March 2017, with registration number ES-MD-000334. The organization currently has an Integrated Management System under the following standards: The Integrated Management System encompasses both the activities carried out at our factory in Humanes and those carried out at our headquarters in Madrid, in relation to the design and production of plant protection products, which directly affect the final quality perceived by the customer and the environment. The organization hereby submits this annual update of the Environmental Statement for validation.
Location and contact
Address: C/ Príncipe de Vergara 110, 5th floor, 28002, Madrid – Tel: 91 690 98 83 / 91 690 69 08 – Email: maribel.garcia@adama.com
Website: https://www.adama.com/spain/es
.
Primary and secondary CNAE code:CNAE 20 20,
|
Environmental policy |
Organizational Policy
POLICY: EHSQ Policy ADAMA-4a37922d
Mission
ADAMA was created to contribute to the development of the plant health sector, offering farmers the widest range of products, processes, and services for improving and protecting their crops, strengthening the trust of our customers, shareholders, and employees, and respecting the environment.
.
Vision
The ADAMA team of professionals seeks to build close relationships with its internal and external customers in order to understand their needs and changes and increase the use of resources so that it can offer products and services backed by continuous improvement of internal processes.
Values
- We encourage continuous improvement to achieve maximum organizational efficiency.
- We are moving towards a group of rigorous professionals with a capacity for service, which provides a differentiating factor and prestige in the market.
- We prioritize compliance with our professional and legislative obligations, committing ourselves to complying with applicable legal requirements, as well as others that Adama voluntarily subscribes to.
- We convey security, flexibility, and accessibility with our products and services. We are all customers and suppliers within the organization.
- We are not afraid of the future and face the challenges of new markets with confidence in a changing reality through a dynamic organization.
- We promote sustainable solutions within the organization by minimizing environmental impacts, as well as for our customers by expanding our range of sustainable products.
- We prioritize the safety of our employees and subcontractors by promoting safe working conditions at all levels.
- Senior management and all employees are particularly committed to ensuring the quality of our products, services, and processes, protecting the environment, and ensuring the health and safety of all stakeholders in the organization by eliminating hazards and reducing risks arising from and associated with our activities.
- Encourage consultation and participation by employees in different areas of the organization to ensure their involvement and contribution to the development of the organization.
These principles are applicable to Quality Management, Environmental Management, Occupational Health and Safety Management, and Major Accidents Management, for which the organization maintains a system in accordance with the UNE-EN ISO 9001 "Quality Management Systems. Requirements," UNE-EN ISO 14001 "Environmental Management Systems: Requirements with guidance for use," EMAS Regulation, UNE-EN ISO 45001:2018 "Occupational Health and Safety Management Systems: Requirements with guidance for use," and RD 840/2015 of September 21, which approves measures to control the risks inherent in serious accidents involving hazardous substances.
In addition to management's commitment to continuous improvement, minimizing environmental impacts, and preventing damage and deterioration of health, we focus on meeting the requirements of interested parties.
 |
Communication and participation |
Communication and stakeholder engagement
A very important aspect of the Environmental Management System implemented at ADAMA is the training of each and every employee. We consider all levels of the organization, including management, which is why we have annual training and environmental awareness plans.
In addition, basic information is provided to all employees of maintenance contractors who work in the factory. This ensures that all personnel operating in our facilities are familiar with the system, its organization, policy, and the most significant environmental aspects.
ADAMA also aims to ensure that the Integrated Management System at its factory in Humanes de Madrid is completely transparent and open to all its employees, suppliers, subcontractors, and the general public.
Any employee can make suggestions for improvement, complaints, suggestions, etc., either directly or through their line managers. With the implementation of the new whiteboards and a platform on SharePoint, the aim is to improve this internal communication.
ADAMA also uses the most widespread means of communication and dissemination today, the Internet. Through its website, www.adama.com, it makes available to "Stakeholders" and the general public information on the operation of its system and the most significant environmental aspects, all of which is reflected in the "Environmental Statement," which is periodically updated on the website. In addition, the website contains the company's certificates and its integrated management systems policy.
Emergency plans
Both in the case of mass production of water, which can be generated for firefighting, and in cases of large-scale chemical spills, for example, effective safety drainage systems are available for this water, with a final reservoir with a capacity to hold up to 500 m³ of liquid. This would prevent any type of escape to the outside and the collected water could be disposed of later in the safest way possible.
The ADAMA factory in Humanes de Madrid has an Internal Emergency Plan (PEI) that covers all possible environmental emergency situations that could occur on the premises:
- Spills/leaks of combustible/corrosive/flammable products.
- Fire involving flammable/toxic products.
- Spills of polluting products.
- Special emergencies:
- Natural hazards (floods, etc.).
- Bomb threats
The PEI aims to establish and define the responsibilities, actions, and notifications required in the event of an emergency at the plant's facilities. The Humanes de Madrid factory updated it in April 2024 and it was approved by the Accredited Control Body.
During 2022 and 2023, emergency drills were carried out at the plant and laboratory, with the ADR dangerous goods advisor and the Parla fire department in attendance. In addition, the corresponding tests were carried out on the foam extinguishers in the flammable materials warehouse and a serious accident drill was conducted. Feedback was obtained from these drills and visits by the fire department to improve the performance of the human and material resources involved in them.
The Madrid Headquarters has Basic Emergency Response Procedures in place, which are fully compatible with the building's Emergency Plan. An annual drill is carried out in the building. Environmental drills are also carried out on an ad hoc basis (2022). In 2024, a drill will be carried out to update the building's PAU, and in 2025, a new environmental drill is planned for the offices.
Social information
Link here to our main social networks.
 |
 |
 |
 |
Environmental assessment and performance |
|
Key metrics |
◉ Global indicators 2024
Includes the sum of all the organisation's sites under the EMAS Register.
ENERGY CONSUMPTION

1,582.38MWh
• Renewable energy consumption 57.46%
• Renewable generation:10%
WATER CONSUMPTION

4,520m³
• Supply network36.35%
Source Well | Network
SANITARY DISCHARGES

399cubic meters
•100% sewerage system
CO2 EMISSIONS

229,216tons
• Indirect: 80.36%
• Direct 19.64%
WASTE

2,153tons
• Hazardous 91.9%
• Recovery 84.21%
Unit values on production/performance
0.152 MWh/Tons produced
0.43 m3/Tons produced
0.04 m3/Tons produced
0.02 Tn/Tons produced
0.21 Tn/Tons produced
|
Dimension of the activity |
Description of the main activity
The activity carried out at the facilities is the formulation (mixing) of phytosanitary products and other agrochemical products and their packaging. Within the facilities, raw materials are mixed and dissolved, both in liquid and solid form, using water and various solvents to obtain final products in liquid form and excipients. Under no circumstances are chemical transformations carried out, nor are solid substances packaged. Once the mixture has been made, it is then packaged, palletized, and sent to the appropriate storage warehouses. After a maximum of 72 hours of storage at our facilities, the formulated products are sent to external logistics operators, who deliver them to the end users of our products, or directly to the customer from the facility.

Evolution of production activity
Business performance
Activity by type
Type of productive activity
| HOLDING | COMPANY | SITE | STATUS | wdt_ID | userid | YEAR | rp | SCOPE | CENTER | MAGNITUDE | UNIT | ACTIVITY | %RECYCLED | % Hazardous | SALES (€) | DESTINATION COUNTRY | REF. REPORT | REMARKS | link route | post_author | post_type |
|---|---|---|---|---|---|---|---|---|---|---|---|---|---|---|---|---|---|---|---|---|---|
| VALIDATED | 256 | 2.098 | 2021 | PRODUCTION | Factory | 11.014,00 | Tn tons | Phytosanitary products | Spain | EMAS | 2.098 | emas_statement | |||||||||
| VALIDATED | 257 | 2.098 | 2022 | PRODUCTION | Factory | 15.078,00 | Tn tons | Phytosanitary products | Spain | EMAS | 2.098 | emas_statement | |||||||||
| VALIDATED | 258 | 2.098 | 2023 | PRODUCTION | Factory | 14.619,00 | Tn tons | Phytosanitary products | Spain | EMAS | 2.098 | emas_statement | |||||||||
| VALIDATED | 259 | 2.098 | 2024 | PRODUCTION | Factory | 10.383,00 | Tn tons | Phytosanitary products | Spain | EMAS | 2.098 | emas_statement | |||||||||
 |
Energy use and management |
Energy management
The energy consumed at the production plant in Humanes de Madrid is mainly electricity and diesel fuel. In the case of the offices, both in Méndez Álvaro and Príncipe de Vergara, consumption is exclusively electrical. Electricity at the plant is generally used in all production activities, for internal lighting at the plant, and for daily use in the offices. In the offices, consumption is mainly for lighting and computer and office equipment. In the factory, diesel fuel is used for the internal movement of goods by forklift trucks, in the case of diesel B, and for heating water for sanitary use, tank coils, bain-maries, and the heating of packaging rooms in the winter months, in the case of diesel C.
Environmental management and control
Photovoltaic panels are available for self-generation without surplus electrical energy. The warehouses do not have meters to measure the energy generated or consumed by them. Therefore, an estimated calculation of production is presented.
During 2024, compared to previous years, the consumption ratio has increased. The installation of automation improvements has increased the plant's electricity needs. Although the best available techniques are applied for this purpose, the consumption ratio has been affected.
In the case of the Príncipe de Vergara offices, as consumption is related to the number of staff present at the facilities, it is skewed by the division of staff working from home and therefore not present in the offices.
With regard to fossil fuels, there has been an increase in diesel consumption per ton produced during 2024. This is due to the decrease in production and the movement of goods. It should be noted that facilities such as bathrooms require the same operating energy regardless of the tons produced, as this is related to the operating hours and start-ups of these facilities.
Evolution of specific metrics and ratios
Units of energy consumption in MWh and their ratios associated with the activity.
Energy consumption by fuel
Uses of energy
The energy magnitudes are always parameterized in MWh, showing in each cell its transformation to GJ, by means of the standard MWh*3.6 conversion (factor officially recognized and used by the SI (BIPM), Eurostat, IEA, IPCC and in Spain by MITECO).
| post_type | post_author | wdt_ID | userid | Year | Center | Units Pr. | Unit | Uses / Info | Electricity Consumption (MWh) | LNG/LPG consumption (MWh) | gasnatural_gl | ind_gasnatural_gl | Oil / Coal (MWh) | tankers_gl | ind_petroliferos_gl | Other Consumption (MWh) | other_gl | Electricity Ratio (Units Pr. | ind_other_gl | GN RatioPr.Units Pr. | Gasoline Ratio (Units Pr. | Ratio of other MWh toUnits Pr. | Total consumption ratio (Units Pr. | Total consumption (MWh) | Ratio of Total GJ/ Udp | Total GJ | Electrical in GJ | Electric GJ/udp Ratio |
|---|---|---|---|---|---|---|---|---|---|---|---|---|---|---|---|---|---|---|---|---|---|---|---|---|---|---|---|---|
| attachment | 2.098 | 282 | 2.098 | 2022 | Factory | 15.078,000 | Tons produced | Production | 1.424,830 | 0,000 | 0,000 | 0,000 | 214,350 | 771,660 | 0,051 | 0,000 | 0,000 | 0,0945 | 0,000 | 0,0000 | 0,0142 | 0,0000 | 0,1087 | 1.639,180 | 0,391 | 5.901,048 | 5.129,388 | 0,340 |
| attachment | 2.098 | 283 | 2.098 | 2023 | Factory | 14.619,000 | Tons produced | Production | 1.543,490 | 0,000 | 0,000 | 0,000 | 264,400 | 951,840 | 0,065 | 0,000 | 0,000 | 0,1056 | 0,000 | 0,0000 | 0,0181 | 0,0000 | 0,1237 | 1.807,890 | 0,445 | 6.508,404 | 5.556,564 | 0,380 |
| attachment | 2.098 | 284 | 2.098 | 2024 | Factory | 10.383,000 | Tons produced | Production | 1.353,200 | 0,000 | 0,000 | 0,000 | 208,350 | 750,060 | 0,072 | 0,000 | 0,000 | 0,1303 | 0,000 | 0,0000 | 0,0201 | 0,0000 | 0,1504 | 1.561,550 | 0,541 | 5.621,580 | 4.871,520 | 0,469 |
| attachment | 2.098 | 285 | 2.098 | 2022 | Offices | 36,000 | Number of employees | Production | 20,700 | 0,000 | 0,000 | 0,000 | 0,000 | 0,000 | 0,000 | 0,000 | 0,000 | 0,5750 | 0,000 | 0,0000 | 0,0000 | 0,0000 | 0,5750 | 20,700 | 2,070 | 74,520 | 74,520 | 2,070 |
| attachment | 2.098 | 286 | 2.098 | 2023 | Offices | 36,000 | Number of employees | Production | 20,927 | 0,000 | 0,000 | 0,000 | 0,000 | 0,000 | 0,000 | 0,000 | 0,000 | 0,5813 | 0,000 | 0,0000 | 0,0000 | 0,0000 | 0,5813 | 20,927 | 2,093 | 75,337 | 75,337 | 2,093 |
| attachment | 2.098 | 287 | 2.098 | 2024 | Offices | 26,000 | Number of employees | Production | 20,830 | 0,000 | 0,000 | 0,000 | 0,000 | 0,000 | 0,000 | 0,000 | 0,000 | 0,8012 | 0,000 | 0,0000 | 0,0000 | 0,0000 | 0,8012 | 20,830 | 2,884 | 74,988 | 74,988 | 2,884 |
| Year | Center | |||||||||||||||||||||||||||
| ∑ = $40,178,000 |
 |
Water use and management |
Water management
The uses of water consumed at the Humanes factory are those typical of the process (preparation of formulations), general cleaning, sanitary use (manufacturing and office staff facilities), and testing of the fire protection system. The headquarters where ADAMA is located is a building where all consumption comes from the public supply network and is measured by a general meter used to allocate consumption proportionally to the different tenants. Water is consumed for sanitary purposes. Until the end of 2014, the water used in the factory came exclusively from two of its own wells, registered with the Tagus Hydrographic Confederation on October 23, 1997. Since January 2015, water consumption at the facility can be sourced both from the company's own wells and from the public supply network of Canal de Isabel II.

Environmental management and control
In the case of Príncipe de Vergara, we cannot determine water consumption because there is no meter exclusively for the office.
However, water consumption at the factory is divided between production processes, general cleaning, sanitary uses, and the fire prevention system. In these cases, factory consumption has increased in relative terms compared to previous years.
Evolution of specific metrics and ratios
Water consumption (m³) and ratios
Water Uses
| state | wdt_ID | userid | Year | Center | Units Pr. | Unit | Origin of water | Uses | m3 | ID | post_author | Ratio (Units Pr. |
|---|---|---|---|---|---|---|---|---|---|---|---|---|
| VALIDATED | 218 | 2.098 | 2022 | Factory | 15.078 | Tons produced | Wells | Production | 2.390,000 | 129.657 | 2.098 | 0,158509 |
| VALIDATED | 219 | 2.098 | 2022 | Factory | 15.078 | Tons produced | Public supply network | Production | 2.895,000 | 129.657 | 2.098 | 0,192002 |
| VALIDATED | 220 | 2.098 | 2022 | Factory | 15.078 | Tons produced | Surface catchment | Production | 197,000 | 129.657 | 2.098 | 0,013065 |
| VALIDATED | 221 | 2.098 | 2023 | Factory | 14.619 | Tons produced | Wells | Production | 2.026,000 | 129.657 | 2.098 | 0,138587 |
| VALIDATED | 222 | 2.098 | 2023 | Factory | 14.619 | Tons produced | Public supply network | Production | 2.324,000 | 129.657 | 2.098 | 0,158971 |
| VALIDATED | 223 | 2.098 | 2023 | Factory | 14.619 | Tons produced | Surface catchment | Production | 34,000 | 129.657 | 2.098 | 0,002326 |
| VALIDATED | 224 | 2.098 | 2024 | Factory | 10.383 | Tons produced | Wells | Production | 2.818,000 | 129.657 | 2.098 | 0,271405 |
| VALIDATED | 225 | 2.098 | 2024 | Factory | 10.383 | Tons produced | Public supply network | Production | 1.643,000 | 129.657 | 2.098 | 0,158239 |
| VALIDATED | 226 | 2.098 | 2024 | Factory | 10.383 | Tons produced | Surface catchment | Production | 59,000 | 129.657 | 2.098 | 0,005682 |
| state | wdt_ID | userid | Year | Center | Origin of water | Uses | ID | post_author |
Note:
 |
Waste water discharge management |
Wastewater management
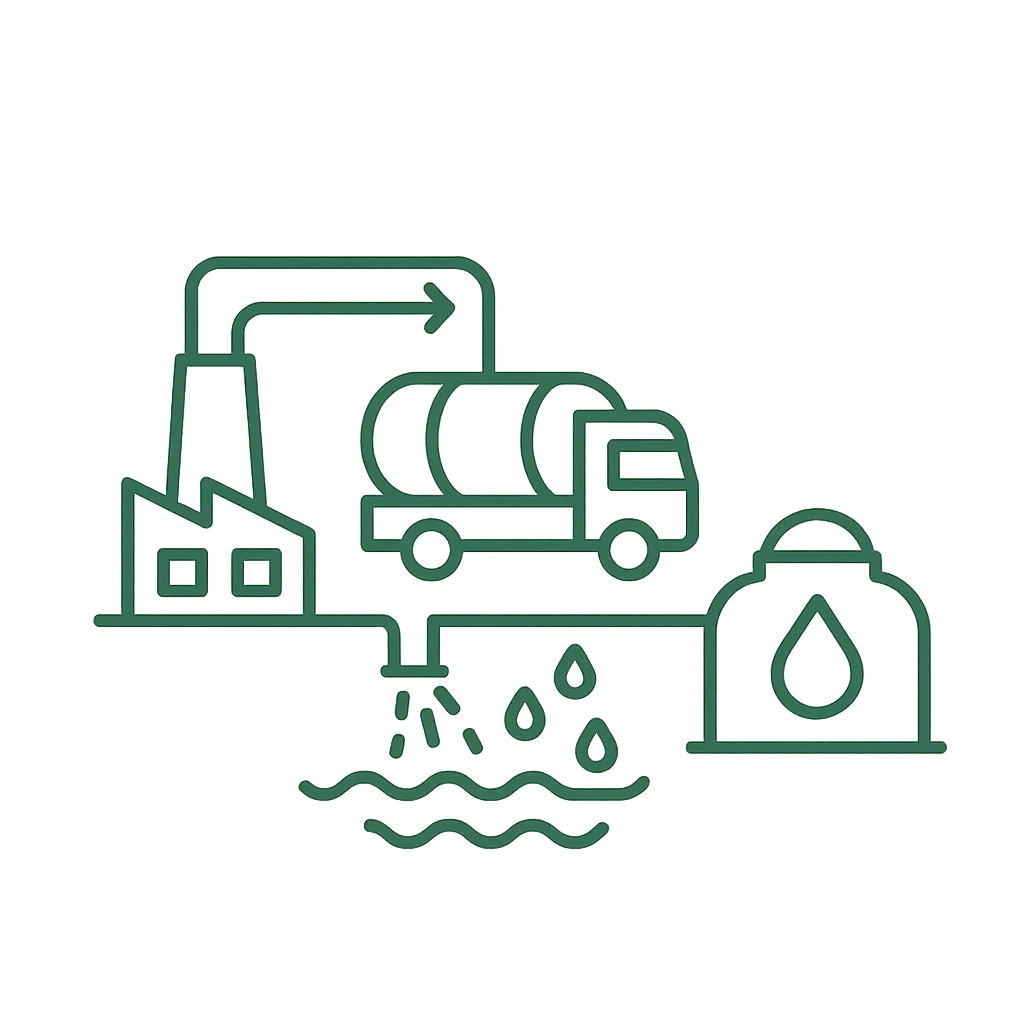
There is no industrial wastewater discharge at our factory. All water used to wash equipment, as well as industrial water, is not discharged but stored in tanks from where it is loaded and transported by waste management companies for disposal outside our premises. The only discharge is sanitary water from the factory toilets. Rainwater collected from runoff during rainfall is added to this water. The discharge is made to the municipal collector in Humanes de Madrid.
Environmental management and control
At the beginning of 2024, in accordance with internal procedures, measurements will be taken only from the laboratory manhole. Once the Integrated Environmental Authorization has been obtained, these requirements will be adapted to the company's internal procedures. Every three years, analyses of sanitary wastewater are carried out. The results of the latest checks carried out by different approved laboratories show compliance with the mandatory discharge limits. As for sanitary waste from the Madrid headquarters, it is combined with waste from the rest of the building's floors and sent to the public sewer system of the city of Madrid.
Public waterway receiving the discharge: Public sewer
| state | wdt_ID | userid | Year | Center | Units Pr. | Unit | Pollutant | Destination | Concentration | Limit | Conc. unit | Mass value kg | Total Volume m3 | pre-set concentration | ID | post_author |
|---|---|---|---|---|---|---|---|---|---|---|---|---|---|---|---|---|
| VALIDATED | 719 | 2.098 | 2022 | Factory | 15.078,000 | Tons produced | pH | Public sewer | 8,100 | 6-10 | 129.657 | 2.098 | ||||
| VALIDATED | 720 | 2.098 | 2022 | Factory | 15.078,000 | Tons produced | Conductivity | Public sewer | 749,000 | 7500 | μS/cm | 129.657 | 2.098 | |||
| VALIDATED | 721 | 2.098 | 2022 | Factory | 15.078,000 | Tons produced | Temperature | Public sewer | 22,000 | 40 | °C | 129.657 | 2.098 | |||
| VALIDATED | 722 | 2.098 | 2022 | Factory | 15.078,000 | Tons produced | DBO5 | Public sewer | 146,000 | 1000 | mg O2/liter | 129.657 | 2.098 | |||
| VALIDATED | 723 | 2.098 | 2022 | Factory | 15.078,000 | Tons produced | COD | Public sewer | 79,000 | 1750 | mg O2/liter | 129.657 | 2.098 | |||
| VALIDATED | 725 | 2.098 | 2022 | Factory | 15.078,000 | Tons produced | Oils and fats | Public sewer | 1,700 | 100 | mg/l | 129.657 | 2.098 | |||
| VALIDATED | 730 | 2.098 | 2022 | Factory | 15.078,000 | Tons produced | Ecotoxicity | Public sewer | 2,000 | 25 | equitox/m3 | 129.657 | 2.098 | |||
| VALIDATED | 732 | 2.098 | 2024 | Factory (laboratory box) | 10.383,000 | Tons produced | pH | Public sewer | 7,780 | 6-10 | 129.657 | 2.098 | ||||
| VALIDATED | 733 | 2.098 | 2024 | Factory (laboratory box) | 10.383,000 | Tons produced | Conductivity | Public sewer | 550,000 | 7500 | μS/cm | 129.657 | 2.098 | |||
| VALIDATED | 734 | 2.098 | 2024 | Factory (laboratory box) | 10.383,000 | Tons produced | Temperature | Public sewer | 19,000 | 40 | °C | 129.657 | 2.098 | |||
| VALIDATED | 735 | 2.098 | 2024 | Factory (laboratory box) | 10.383,000 | Tons produced | DBO5 | Public sewer | 5,000 | 1000 | mg O2/liter | 129.657 | 2.098 | |||
| VALIDATED | 736 | 2.098 | 2024 | Factory (laboratory box) | 10.383,000 | Tons produced | COD | Public sewer | 36,000 | 1750 | mg O2/liter | 129.657 | 2.098 | |||
| VALIDATED | 737 | 2.098 | 2024 | Factory (laboratory box) | 10.383,000 | Tons produced | Suspended solids | Public sewer | 13,000 | 1000 | mg/liter | 129.657 | 2.098 | |||
| VALIDATED | 738 | 2.098 | 2024 | Factory (laboratory box) | 10.383,000 | Tons produced | Oils and fats | Public sewer | 2,500 | 100 | mg/l | 129.657 | 2.098 | |||
| VALIDATED | 739 | 2.098 | 2024 | Factory (laboratory box) | 10.383,000 | Tons produced | Detergents | Public sewer | 5,000 | mg/l | 129.657 | 2.098 | ||||
| VALIDATED | 740 | 2.098 | 2024 | Factory (laboratory box) | 10.383,000 | Tons produced | Anionic detergents | Public sewer | 1,300 | mg/l | 129.657 | 2.098 | ||||
| VALIDATED | 741 | 2.098 | 2024 | Factory (laboratory box) | 10.383,000 | Tons produced | Cationic detergents | Public sewer | 0,500 | mg/l | 129.657 | 2.098 | ||||
| VALIDATED | 742 | 2.098 | 2024 | Factory (laboratory box) | 10.383,000 | Tons produced | Ionic detergents | Public sewer | 4,000 | mg/l | 129.657 | 2.098 | ||||
| VALIDATED | 743 | 2.098 | 2024 | Factory (laboratory box) | 10.383,000 | Tons produced | Ecotoxicity | Public sewer | 13,000 | 25 | equitox/m3 | 129.657 | 2.098 | |||
| VALIDATED | 744 | 2.098 | 2024 | Factory (laboratory box) | 10.383,000 | Tons produced | Total Nitrogen | Public sewer | 11,000 | 125 | mg/l | 129.657 | 2.098 | |||
| VALIDATED | 745 | 2.098 | 2024 | Factory (laboratory box) | 10.383,000 | Tons produced | Total Phosphorus | Public sewer | 0,700 | 40 | mg/l | 129.657 | 2.098 | |||
| VALIDATED | 746 | 2.098 | 2024 | Factory (laboratory box) | 10.383,000 | Tons produced | Wastewater (workshop + changing rooms m³) | Public sewer | m3 | 399,000 | 129.657 | 2.098 | ||||
| state | wdt_ID | userid | Year | Center | Unit | Pollutant | Destination | |||||||||
| ∑ = $261,291.00 |
 |
Atmospheric emissions |
Emissions management
Our factory carries out formulation and packaging activities, consisting of physicochemical processes of mixing, dispersion, grinding, homogenization, and packaging, none of which involve any chemical reaction. For this reason, there are no emissions to the atmosphere derived from this type of operation. At the ADAMA factory, we distinguish between two groups of emission sources, which are subject to control in accordance with current legislation: particle sources and combustion process sources (NOx, SO2, CO, and opacity). The following table summarizes the emission limit values and the values obtained in regulatory controls. It should be noted that our Scope 2 CO2eq emissions derived from electricity consumption have been zero since 2020 due to the acquisition of 100% renewable energy and photovoltaic generation.

Environmental management and control
Attached are mass emission values calculated by emission factor for CO2eq gases, including CH4 and N20 generated by diesel consumption at the plant. On the other hand, with regard to SF6 / HFCs / PFCs / NF3 /SF6 gases: Possible emissions would derive from fugitive emissions from fire extinguishing systems or air conditioning systems: During 2023, there have been no "triggers" of our extinguishing systems, nor have there been any leaks of refrigerants in our air conditioning systems. Based on data from the refrigeration facility maintenance provider, there is no record of any hydrofluorocarbon (HFC) leaks.
| state | wdt_ID | userid | Year | Center | Origin/Type | Units Pr. | Unit | Pollutant | Concentration | Conc. unit | Limit | Mass emission (kg) | Ratio (kg/unit) | Spotlight | ID | post_author |
|---|---|---|---|---|---|---|---|---|---|---|---|---|---|---|---|---|
| VALIDATED | 518 | 2.098 | 2022 | Factory | Vehicle emission source | 15.078,000 | Tons produced | CO | 500 | 83,3599999999999994 | 0,0055285846929301 | 129.651 | 2.098 | |||
| VALIDATED | 519 | 2.098 | 2022 | Factory | Vehicle emission source | 15.078,000 | Tons produced | SO2 | 180 | 27,0000000000000000 | 0,0017906884202149 | 129.651 | 2.098 | |||
| VALIDATED | 520 | 2.098 | 2022 | Factory | Vehicle emission source | 15.078,000 | Tons produced | NOx | 180 | 189,9600000000000080 | 0,0125984878631118 | 129.651 | 2.098 | |||
| VALIDATED | 521 | 2.098 | 2022 | Factory | Vehicle emission source | 15.078,000 | Tons produced | Particles | 3,1299999999999999 | 0,0002075872131582 | 129.651 | 2.098 | ||||
| VALIDATED | 522 | 2.098 | 2023 | Factory | Vehicle emission source | 14.619,000 | Tons produced | CO | 500 | 95,6400000000000006 | 0,0065421711471373 | 129.651 | 2.098 | |||
| VALIDATED | 523 | 2.098 | 2023 | Factory | Vehicle emission source | 14.619,000 | Tons produced | SO2 | 180 | 18,8999999999999986 | 0,0012928380874205 | 129.651 | 2.098 | |||
| VALIDATED | 524 | 2.098 | 2023 | Factory | Vehicle emission source | 14.619,000 | Tons produced | NOx | 180 | 194,4199999999999875 | 0,0132991312675286 | 129.651 | 2.098 | |||
| VALIDATED | 525 | 2.098 | 2023 | Factory | Vehicle emission source | 14.619,000 | Tons produced | Particles | 2,9399999999999999 | 0,0002011081469321 | 129.651 | 2.098 | ||||
| VALIDATED | 526 | 2.098 | 2023 | Factory | Vehicle emission source | 14.619,000 | Tons produced | Voc's | 75,0199999999999960 | 0,0051316779533484 | 129.651 | 2.098 | ||||
| VALIDATED | 527 | 2.098 | 2024 | Factory | Vehicle emission source | 10.383,000 | Tons produced | CO | 500 | 91,6200000000000045 | 0,0088240392950014 | 129.651 | 2.098 | |||
| VALIDATED | 528 | 2.098 | 2024 | Factory | Vehicle emission source | 10.383,000 | Tons produced | SO2 | 180 | 18,3399999999999999 | 0,0017663488394491 | 129.651 | 2.098 | |||
| VALIDATED | 529 | 2.098 | 2024 | Factory | Vehicle emission source | 10.383,000 | Tons produced | NOx | 180 | 188,8199999999999932 | 0,0181854955215256 | 129.651 | 2.098 | |||
| VALIDATED | 530 | 2.098 | 2024 | Factory | Vehicle emission source | 10.383,000 | Tons produced | Particles | 2,9399999999999999 | 0,0002831551574689 | 129.651 | 2.098 | ||||
| VALIDATED | 531 | 2.098 | 2024 | Factory | Vehicle emission source | 10.383,000 | Tons produced | Voc's | 75,0199999999999960 | 0,0072252720793605 | 129.651 | 2.098 | ||||
 |
CO2 emissions |
CO₂ emissions per center.
GHG calculated
| wdt_ID | userid | Year | Center | Units Pr. | Units | Origin/Type | CO2eq Direct (S1) | CO2eq Indirect (S2) | CO2eq Indirect (S3) | Category GHG (S3) | ID | post_author | CO2eq Saved/Compensated | T CO2eq Total | TotalUnits Pr. | DirectUnits ratio | IndirectUnits ratio | SavedUnits Pr. |
|---|---|---|---|---|---|---|---|---|---|---|---|---|---|---|---|---|---|---|
| 334 | 2.098 | 2022 | Factory | 15.078,000 | Tons produced | CO2 emission sources | 0,343 | 0,000 | 129.657 | 2.098 | 0,343 | 0,000023 | 0,000023 | 0,000000 | 0,000000 | |||
| 335 | 2.098 | 2023 | Factory | 14.619,000 | Tons produced | CO2 emission sources | 0,011 | 0,000 | 129.657 | 2.098 | 0,011 | 0,000001 | 0,000001 | 0,000000 | 0,000000 | |||
| 336 | 2.098 | 2024 | Factory | 10.383,000 | Tons produced | CO2 emission sources | 0,011 | 0,000 | 129.657 | 2.098 | 0,011 | 0,000001 | 0,000001 | 0,000000 | 0,000000 | |||
| 337 | 2.098 | 2024 | Factory | 10.383,000 | Tons produced | CO2 from electricity consumption NO RENOV | 0,000 | 184,200 | 129.657 | 2.098 | 184,200 | 0,017741 | 0,000000 | 0,017741 | 0,000000 | |||
| 341 | 2.098 | 2022 | Factory | 15.078,000 | Tons produced | CO2 from B and C Gasoil consumption | 55,970 | 0,000 | 129.657 | 2.098 | 55,970 | 0,003712 | 0,003712 | 0,000000 | 0,000000 | |||
| 342 | 2.098 | 2023 | Factory | 14.619,000 | Tons produced | CO2 from consumption of diesel fuel B for forklift trucks | 69,010 | 0,000 | 129.657 | 2.098 | 69,010 | 0,004721 | 0,004721 | 0,000000 | 0,000000 | |||
| 343 | 2.098 | 2024 | Factory | 10.383,000 | Tons produced | CO2 from consumption of diesel fuel B for forklift trucks | 45,005 | 0,000 | 129.657 | 2.098 | 45,005 | 0,004334 | 0,004334 | 0,000000 | 0,000000 | |||
| 361 | 2.098 | 2024 | Offices | 26,000 | Number of employees | CO2 SAVED by electricity consumption RENOV | 0,000 | 0,000 | 129.657 | 2.098 | -3,402 | 0,000 | 0,000000 | 0,000000 | 0,000000 | 0,130846 | ||
| 362 | 2.098 | 2023 | Offices | 36,000 | Number of employees | CO2 SAVED by electricity consumption RENOV | 0,000 | 0,000 | 129.657 | 2.098 | -3,390 | 0,000 | 0,000000 | 0,000000 | 0,000000 | 0,094167 | ||
| 363 | 2.098 | 2022 | Offices | 36,000 | Number of employees | CO2 SAVED by electricity consumption RENOV | 0,000 | 0,000 | 129.657 | 2.098 | -2,847 | 0,000 | 0,000000 | 0,000000 | 0,000000 | 0,079083 | ||
| 364 | 2.098 | 2022 | Factory | 15.078,000 | Tons produced | CO2 SAVED by electricity consumption RENOV | 0,000 | 0,000 | 129.657 | 2.098 | -193,100 | 0,000 | 0,000000 | 0,000000 | 0,000000 | 0,012807 | ||
| 365 | 2.098 | 2023 | Factory | 14.619,000 | Tons produced | CO2 SAVED by electricity consumption RENOV | 0,000 | 0,000 | 129.657 | 2.098 | -250,045 | 0,000 | 0,000000 | 0,000000 | 0,000000 | 0,017104 | ||
| 366 | 2.098 | 2024 | Factory | 10.383,000 | Tons produced | CO2 SAVED by electricity consumption RENOV | 0,000 | 0,000 | 129.657 | 2.098 | -24,216 | 0,000 | 0,000000 | 0,000000 | 0,000000 | 0,002332 | ||
| Year | Center | Origin/Type |
Note: (*) Until 2009, the reference limits were those set out in Decree 833/75, a regulation implementing Law 38/1972 on the protection of the atmosphere. Since 2009, it has been governed by the Resolution of March 12, 2009, which implements procedures for the monitoring and control of industrial atmospheric pollution in the Community of Madrid. New legislation ROYAL DECREE 1042/2017, OF DECEMBER 22, ON THE LIMITATION OF ATMOSPHERIC EMISSIONS OF CERTAIN POLLUTANTS FROM MEDIUM-SIZED COMBUSTION PLANTS AND UPDATING ANNEX IV OF LAW 34/2007, OF NOVEMBER 15, ON AIR QUALITY AND PROTECTION OF THE ATMOSPHERE. Applicable to existing installations from 2025 onwards.
 |
Waste production and management |
GenerWaste generation
The waste generated at our Madrid offices includes Hazardous waste Hazardous paper, toner, and organic waste, as well as Hazardous waste Hazardous fluorescent tubes. Most of this waste is Hazardous to municipal or urban waste. As for our factory, the waste generated there is managed off-site by authorized waste management companies in accordance with applicable regulations regarding storage, labeling, and disposal.

Environmental management and control
In offices, over the years we have seen changes in the waste generated as a result of administrative work and the implementation of new technologies, which have led to the need to add new Hazardous waste categories Hazardous electronic components—to the registry. We have observed a significant increase in the amount of paper managed by the waste management company. This is due to a review of the archives and the disposal of a large amount of documentation in preparation for the change of registered and tax addresses.
With regard to our factory, the waste generated there is managed off-site by authorized waste management companies, and we highlight the following:
a) Solid waste comparable to municipal waste and industrial waste ( Hazardous). In 2024, it has become clear that although we have made efforts to minimize the absolute amounts of waste generated by the plant, we see that in terms of production volume, we have not managed to reduce but rather increase the amount of waste generated (from 16.4% to 20.7%). Therefore, the measures implemented have not been effective in achieving waste-related objectives. It is therefore necessary to consider additional actions that will influence waste generation reduction in other ways, set more realistic targets, and more closely monitor the quantities generated per unit of production. Consequently, we can state that although most of our waste is recycled or recyclable, we need to work on reusing and reducing it.
b) Recyclable/recoverable solid waste. In 2024, it has become clear that although we have made efforts to minimize the absolute amounts of waste generated by the plant, we see that in relative terms to production, we have not managed to reduce but rather increase the amount of waste generated (from 16.4% to 20.7%). Therefore, the measures implemented have not been effective in achieving the waste-related objectives. It is therefore necessary to consider additional actions that will have a different impact on reducing waste generation, set more realistic targets, and monitor the quantities generated per production more closely. We can therefore state that although most of our waste is recycled or recyclable, we need to work on reusing and reducing it.
c) Hazardous Waste. Under this category, the legislation covers all materials that will not be reused and that could, in theory, pose a risk. In 2021, a review of the waste generated in Humanes was conducted, incorporating EWC codes into its disposal framework, and the relevant notification was submitted to the competent authority in early 2022.
Evolution of specific metrics and ratios
Type and destination
| wdt_ID | userid | Year | Center | Units Pr. | Units | Non Hazardous | Hazardous | Disposal/ Controlled landfill | Other treatments | Recovery | By-products | post_author | RP Ratio (kg)Units Pr. | NP Ratio (kg)Units Pr. | Totals (t) | Total ratio (t)Units Pr. |
|---|---|---|---|---|---|---|---|---|---|---|---|---|---|---|---|---|
| 118 | 2.098 | 2022 | Factory | 15.078,000 | Tons produced | 189,000 | 2.170,000 | 110,000 | 2.249,000 | 2.098 | 143,91829155 | 12,535 | 2.359,00 | 0,156453110492 | ||
| 119 | 2.098 | 2023 | Factory | 14.619,000 | Tons produced | 207,000 | 2.187,000 | 176,000 | 2.011,000 | 2.098 | 149,59983583 | 14,160 | 2.394,00 | 0,163759491073 | ||
| 120 | 2.098 | 2024 | Factory | 10.383,000 | Tons produced | 174,000 | 1.979,000 | 167,000 | 1.813,000 | 2.098 | 190,60001926 | 16,758 | 2.153,00 | 0,207358181643 | ||
| wdt_ID | userid | Year | Center | post_author | ||||||||||||
| ∑ = $40,080,000 |
List of waste
| wdt_ID | userid | Year | Center | Units Pr. | Units | Description of the waste | CER/LER code | Treatment | Hazardous | Quantity (t) | post_author | Ratio quantity (t)/pdU. |
|---|---|---|---|---|---|---|---|---|---|---|---|---|
| 1.881 | 2.098 | 2022 | Factory | 15.078,000 | Tons produced | Paper/Cardboard | 150101 | R3 | No | 85,080 | 2.098 | 0,005642658177 |
| 1.882 | 2.098 | 2022 | Factory | 15.078,000 | Tons produced | Wooden pallets | 150103 | R3 | No | 60,400 | 2.098 | 0,004005836318 |
| 1.883 | 2.098 | 2022 | Factory | 15.078,000 | Tons produced | Clean empty plastic | 200139 | R3 | No | 25,900 | 2.098 | 0,001717734448 |
| 1.884 | 2.098 | 2022 | Factory | 15.078,000 | Tons produced | Tags (octopus) | 191212 | R12 | No | 13,000 | 2.098 | 0,000862183313 |
| 1.885 | 2.098 | 2022 | Factory | 15.078,000 | Tons produced | Clean empty plastic containers | 150102 | R3 | No | 0,000 | 2.098 | 0,000000000000 |
| 1.886 | 2.098 | 2022 | Factory | 15.078,000 | Tons produced | Scrap | 170405 | R4 | No | 4,560 | 2.098 | 0,000302427378 |
| 1.887 | 2.098 | 2023 | Factory | 14.619,000 | Tons produced | Paper/Cardboard | 150101 | R3 | No | 71,440 | 2.098 | 0,004886791162 |
| 1.888 | 2.098 | 2023 | Factory | 14.619,000 | Tons produced | Wooden pallets | 150103 | R3 | No | 83,160 | 2.098 | 0,005688487585 |
| 1.889 | 2.098 | 2023 | Factory | 14.619,000 | Tons produced | Clean empty plastic | 200139 | R3 | No | 26,240 | 2.098 | 0,001794924413 |
| 1.890 | 2.098 | 2023 | Factory | 14.619,000 | Tons produced | Tags (octopus) | 191212 | R12 | No | 15,860 | 2.098 | 0,001084889527 |
| 1.891 | 2.098 | 2023 | Factory | 14.619,000 | Tons produced | Clean empty plastic containers | 150102 | R3 | No | 0,000 | 2.098 | 0,000000000000 |
| 1.892 | 2.098 | 2023 | Factory | 14.619,000 | Tons produced | Scrap | 170405 | R4 | No | 10,221 | 2.098 | 0,000699158629 |
| 1.893 | 2.098 | 2024 | Factory | 10.383,000 | Tons produced | Paper/Cardboard | 150101 | R3 | No | 63,480 | 2.098 | 0,006113839931 |
| 1.894 | 2.098 | 2024 | Factory | 10.383,000 | Tons produced | Wooden pallets | 150103 | R3 | No | 57,500 | 2.098 | 0,005537898488 |
| 1.895 | 2.098 | 2024 | Factory | 10.383,000 | Tons produced | Clean empty plastic | 200139 | R3 | No | 29,860 | 2.098 | 0,002875854763 |
| 1.896 | 2.098 | 2024 | Factory | 10.383,000 | Tons produced | Tags (octopus) | 191212 | R12 | No | 0,000 | 2.098 | 0,000000000000 |
| 1.897 | 2.098 | 2024 | Factory | 10.383,000 | Tons produced | Scrap | 170405 | R4 | No | 1,070 | 2.098 | 0,000103053068 |
| 1.898 | 2.098 | 2024 | Factory | 10.383,000 | Tons produced | Scrap | 170405 | R4 | No | 21,842 | 2.098 | 0,002103630935 |
| 1.899 | 2.098 | 2022 | Factory | 15.078,000 | Tons produced | Empty pesticide containers (cardboard, paper, contaminated plastic, compressed) | 150110 | D9 | Yes | 49,420 | 2.098 | 0,003277623027 |
| 1.900 | 2.098 | 2022 | Factory | 15.078,000 | Tons produced | Contaminated empty containers (large 1,000-liter container contaminated) | 150110 | - | Yes | 270,520 | 2.098 | 0,017941371535 |
| 1.901 | 2.098 | 2022 | Factory | 15.078,000 | Tons produced | Empty used plastic container (contaminated plastic drum) | 150110 | - | Yes | 52,780 | 2.098 | 0,003500464253 |
| 1.902 | 2.098 | 2022 | Factory | 15.078,000 | Tons produced | Empty laboratory containers (small glass containers) | 150110 | D9 | Yes | 0,090 | 2.098 | 0,000005968961 |
| 1.903 | 2.098 | 2022 | Factory | 15.078,000 | Tons produced | Empty used metal containers | 150110 | - | Yes | 83,480 | 2.098 | 0,005536543308 |
| 1.904 | 2.098 | 2022 | Factory | 15.078,000 | Tons produced | Washing water | 070401 | R1 | Yes | 1.649,360 | 2.098 | 0,109388513065 |
| 1.905 | 2.098 | 2022 | Factory | 15.078,000 | Tons produced | Expired phytosanitary products (obsolete products and materials) | 020108 | D10 | Yes | 27,180 | 2.098 | 0,001802626343 |
| 1.906 | 2.098 | 2022 | Factory | 15.078,000 | Tons produced | Manhole waste | 070410 | D10 | Yes | 15,120 | 2.098 | 0,001002785515 |
| 1.907 | 2.098 | 2022 | Factory | 15.078,000 | Tons produced | Absorbents contaminated with pesticides | 150202 | D9 | Yes | 0,520 | 2.098 | 0,000034487333 |
| 1.908 | 2.098 | 2022 | Factory | 15.078,000 | Tons produced | Used oil | 130208 | R1 | Yes | 0,050 | 2.098 | 0,000003316090 |
| 1.909 | 2.098 | 2022 | Factory | 15.078,000 | Tons produced | Asbestos sheets | 170605 | - | Yes | 11,680 | 2.098 | 0,000774638546 |
| 1.910 | 2.098 | 2022 | Factory | 15.078,000 | Tons produced | Grinding balls | 070413 | D9 | Yes | 0,180 | 2.098 | 0,000011937923 |
| 1.911 | 2.098 | 2022 | Factory | 15.078,000 | Tons produced | Bag filters | 150202 | D10 | Yes | 3,090 | 2.098 | 0,000204934341 |
| 1.912 | 2.098 | 2022 | Factory | 15.078,000 | Tons produced | Fluorescent | 200121 | R4 | Yes | 0,080 | 2.098 | 0,000005305743 |
| 1.913 | 2.098 | 2022 | Factory | 15.078,000 | Tons produced | Contaminated scrap metal | 170409 | - | Yes | 1,120 | 2.098 | 0,000074280409 |
| 1.914 | 2.098 | 2022 | Factory | 15.078,000 | Tons produced | Contaminated debris | 170503 | D5 | Yes | 2,660 | 2.098 | 0,000176415970 |
| 1.915 | 2.098 | 2022 | Factory | 15.078,000 | Tons produced | Electronic components | 200135 | R4 | Yes | 0,760 | 2.098 | 0,000050404563 |
| 1.916 | 2.098 | 2022 | Factory | 15.078,000 | Tons produced | Toners | 080317 | D5 | Yes | 0,050 | 2.098 | 0,000003316090 |
| 1.917 | 2.098 | 2022 | Factory | 15.078,000 | Tons produced | Aerosols | 160504 | R4 | Yes | 0,010 | 2.098 | 0,000000663218 |
| 1.918 | 2.098 | 2022 | Factory | 15.078,000 | Tons produced | Electronic components with gas | 160211 | R4 | Yes | 1,020 | 2.098 | 0,000067648229 |
| 1.919 | 2.098 | 2022 | Factory | 15.078,000 | Tons produced | Empty plastic containers ("ballesta" drums) | 150110 | R5 | Yes | 0,530 | 2.098 | 0,000035150550 |
| 1.920 | 2.098 | 2023 | Factory | 14.619,000 | Tons produced | Empty pesticide containers (cardboard, paper, contaminated plastic, compressed) | 150110 | D9 | Yes | 58,690 | 2.098 | 0,004014638484 |
| 1.921 | 2.098 | 2023 | Factory | 14.619,000 | Tons produced | Contaminated empty containers (large 1,000-liter container contaminated) | 150110 | - | Yes | 260,590 | 2.098 | 0,017825432656 |
| 1.922 | 2.098 | 2023 | Factory | 14.619,000 | Tons produced | Empty used plastic container (contaminated plastic drum) | 150110 | - | Yes | 51,310 | 2.098 | 0,003509815993 |
| 1.923 | 2.098 | 2023 | Factory | 14.619,000 | Tons produced | Empty laboratory containers (small glass containers) | 150110 | D9 | Yes | 0,090 | 2.098 | 0,000006156372 |
| 1.924 | 2.098 | 2023 | Factory | 14.619,000 | Tons produced | Empty used metal containers | 150110 | - | Yes | 76,400 | 2.098 | 0,005226075655 |
| 1.925 | 2.098 | 2023 | Factory | 14.619,000 | Tons produced | Washing water | 070401 | R1 | Yes | 1.619,810 | 2.098 | 0,110801696422 |
| 1.926 | 2.098 | 2023 | Factory | 14.619,000 | Tons produced | Expired phytosanitary products (obsolete products and materials) | 020108 | D10 | Yes | 73,210 | 2.098 | 0,005007866475 |
| 1.927 | 2.098 | 2023 | Factory | 14.619,000 | Tons produced | Manhole waste | 070410 | D10 | Yes | 35,220 | 2.098 | 0,002409193515 |
| 1.928 | 2.098 | 2023 | Factory | 14.619,000 | Tons produced | Absorbents contaminated with pesticides | 150202 | D9 | Yes | 7,190 | 2.098 | 0,000491825706 |
| 1.929 | 2.098 | 2023 | Factory | 14.619,000 | Tons produced | Used oil | 130208 | R1 | Yes | 0,090 | 2.098 | 0,000006156372 |
| 1.930 | 2.098 | 2023 | Factory | 14.619,000 | Tons produced | Bag filters | 150202 | D10 | Yes | 0,950 | 2.098 | 0,000064983925 |
| 1.931 | 2.098 | 2023 | Factory | 14.619,000 | Tons produced | Activated carbon filters | 150202 | D10 | Yes | 0,160 | 2.098 | 0,000010944661 |
| 1.932 | 2.098 | 2023 | Factory | 14.619,000 | Tons produced | Fluorescent | 200121 | R4 | Yes | 0,060 | 2.098 | 0,000004104248 |
| 1.933 | 2.098 | 2023 | Factory | 14.619,000 | Tons produced | Gases in pressure vessels (including halons) containing dangerous substances | R13 | R5 | Yes | 0,020 | 2.098 | 0,000001368083 |
| 1.934 | 2.098 | 2023 | Factory | 14.619,000 | Tons produced | Contaminated scrap metal | 170409 | - | Yes | 1,520 | 2.098 | 0,000103974280 |
| 1.935 | 2.098 | 2023 | Factory | 14.619,000 | Tons produced | Contaminated debris | 170503 | D5 | Yes | 0,820 | 2.098 | 0,000056091388 |
| 1.936 | 2.098 | 2023 | Factory | 14.619,000 | Tons produced | Electronic components | 200135 | R4 | Yes | 0,530 | 2.098 | 0,000036254190 |
| 1.937 | 2.098 | 2023 | Factory | 14.619,000 | Tons produced | Toners | 080317 | D5 | Yes | 0,040 | 2.098 | 0,000002736165 |
| 1.938 | 2.098 | 2023 | Factory | 14.619,000 | Tons produced | Aerosols | 160504 | R4 | Yes | 0,020 | 2.098 | 0,000001368083 |
| 1.939 | 2.098 | 2023 | Factory | 14.619,000 | Tons produced | Electronic components with gas | 160211 | R4 | Yes | 0,520 | 2.098 | 0,000035570148 |
| 1.940 | 2.098 | 2024 | Factory | 10.383,000 | Tons produced | Empty pesticide containers (cardboard, paper, contaminated plastic, compressed) | 150110 | D9 | Yes | 84,150 | 2.098 | 0,008104594048 |
| 1.941 | 2.098 | 2024 | Factory | 10.383,000 | Tons produced | Contaminated empty containers (large 1,000-liter container contaminated) | 150110 | - | Yes | 238,200 | 2.098 | 0,022941346432 |
| 1.942 | 2.098 | 2024 | Factory | 10.383,000 | Tons produced | Empty used plastic container (contaminated plastic drum) | 150110 | - | Yes | 32,480 | 2.098 | 0,003128190311 |
| 1.943 | 2.098 | 2024 | Factory | 10.383,000 | Tons produced | Empty laboratory containers (small glass containers) | 150110 | D9 | Yes | 0,200 | 2.098 | 0,000019262256 |
| 1.944 | 2.098 | 2024 | Factory | 10.383,000 | Tons produced | Empty used metal containers | 150110 | - | Yes | 61,200 | 2.098 | 0,005894250217 |
| 1.945 | 2.098 | 2024 | Factory | 10.383,000 | Tons produced | Washing water | 070401 | R1 | Yes | 1.477,570 | 2.098 | 0,142306655109 |
| 1.946 | 2.098 | 2024 | Factory | 10.383,000 | Tons produced | Expired phytosanitary products (obsolete products and materials) | 020108 | D10 | Yes | 6,790 | 2.098 | 0,000653953578 |
| 1.947 | 2.098 | 2024 | Factory | 10.383,000 | Tons produced | Manhole waste | 070410 | D10 | Yes | 33,450 | 2.098 | 0,003221612251 |
| 1.948 | 2.098 | 2024 | Factory | 10.383,000 | Tons produced | Absorbents contaminated with pesticides | 150202 | D9 | Yes | 0,300 | 2.098 | 0,000028893383 |
| 1.949 | 2.098 | 2024 | Factory | 10.383,000 | Tons produced | Bag filters | 150202 | D10 | Yes | 0,670 | 2.098 | 0,000064528556 |
| 1.950 | 2.098 | 2024 | Factory | 10.383,000 | Tons produced | Activated carbon filters | 150202 | D10 | Yes | 0,370 | 2.098 | 0,000035635173 |
| 1.951 | 2.098 | 2024 | Factory | 10.383,000 | Tons produced | Fluorescent | 200121 | R4 | Yes | 0,020 | 2.098 | 0,000001926226 |
| 1.952 | 2.098 | 2024 | Factory | 10.383,000 | Tons produced | Contaminated scrap metal | 170409 | - | Yes | 3,020 | 2.098 | 0,000290860060 |
| 1.953 | 2.098 | 2024 | Factory | 10.383,000 | Tons produced | Contaminated debris | 170503 | D5 | Yes | 1,650 | 2.098 | 0,000158913609 |
| 1.954 | 2.098 | 2024 | Factory | 10.383,000 | Tons produced | Electronic components | 200135 | R4 | Yes | 0,200 | 2.098 | 0,000019262256 |
| 1.955 | 2.098 | 2024 | Factory | 10.383,000 | Tons produced | Laboratory product | Yes | 0,020 | 2.098 | 0,000001926226 | ||
| 1.956 | 2.098 | 2024 | Factory | 10.383,000 | Tons produced | Aerosols | 160504 | R4 | Yes | 0,050 | 2.098 | 0,000004815564 |
| wdt_ID | userid | Year | Center | Description of the waste | CER/LER code | Treatment | Hazardous | post_author | ||||
| ∑ = $1,026,009.00 |
 |
Management of raw materials and resources |
Management of material resources
The factory in Humanes, Madrid, consumes natural resources and energy. However, specific indicators for raw materials are not considered because the production process consists of simple mixtures with fixed, regulated formulations, leaving no room for optimizing consumption beyond internal control. On the other hand, the manufacture of products and the resulting consumption of materials are a direct consequence of the variable agricultural market (types of annual crops, often greatly influenced by the availability of subsidies, by production quotas established by the EU, and obviously by the weather).

Environmental management and control
With regard to raw materials, their consumption is controlled through the company's computer system, and no reference indicator is established, since the manufacturing processes are simple mixtures, all the materials incorporated into the facilities leave them as formulated products, and the formulations are mixtures with fixed proportions approved by the competent authority. They cannot be varied and therefore there is no possibility of taking action to reduce their consumption beyond the existing internal traceability mechanisms, which is why it is not considered relevant to our significant direct environmental aspects.
We propose, without specifying, reporting on product families consumed and quantities in tons.
Due to administrative tasks, the organization needs to use paper for communication and archiving the documentation necessary to carry out its daily tasks. ADAMA is working on digitization, but there are still many areas where the use of paper is necessary. Paper consumption at the Humanes de Madrid office and the Príncipe de Vergara office.
Evolution of specific metrics and ratios
| wdt_ID | userid | Year | Center | Units Pr. | Units | Type of Materials | % Recycled | % Hazardous | Quantity of raw materials (t) | Quantity of Auxiliary Materials. (t) | Quantity Containers & Packs (t) | Total (t) | Total ratio (t)/LU. | Hazardous Materials (t) | Recycled Materials (t) |
|---|---|---|---|---|---|---|---|---|---|---|---|---|---|---|---|
| 453 | 2.098 | 2022 | Offices | 36,000 | Number of employees | Recycled paper | 100,000 | 0,000 | 0,000 | 0,101 | 0 | 0,10 | 0,0028056 | 0,00 | 0,10 |
| 454 | 2.098 | 2022 | Offices | 36,000 | Number of employees | White paper | 0,000 | 0,000 | 0,000 | 0,018 | 0 | 0,02 | 0,0005000 | 0,00 | 0,00 |
| 455 | 2.098 | 2022 | Factory | 46,000 | Number of employees | Recycled paper | 100,000 | 0,000 | 0,000 | 0,050 | 0 | 0,05 | 0,0010870 | 0,00 | 0,05 |
| 456 | 2.098 | 2022 | Factory | 46,000 | Number of employees | White paper | 0,000 | 0,000 | 0,000 | 0,388 | 0 | 0,39 | 0,0084348 | 0,00 | 0,00 |
| 457 | 2.098 | 2023 | Offices | 36,000 | Number of employees | Recycled paper | 100,000 | 0,000 | 0,000 | 0,113 | 0 | 0,11 | 0,0031389 | 0,00 | 0,11 |
| 458 | 2.098 | 2023 | Offices | 36,000 | Number of employees | White paper | 0,000 | 0,000 | 0,000 | 0,003 | 0 | 0,00 | 0,0000833 | 0,00 | 0,00 |
| 459 | 2.098 | 2023 | Factory | 44,000 | Number of employees | Recycled paper | 100,000 | 0,000 | 0,000 | 0,302 | 0 | 0,30 | 0,0068636 | 0,00 | 0,30 |
| 460 | 2.098 | 2023 | Factory | 44,000 | Number of employees | White paper | 0,000 | 0,000 | 0,000 | 0,035 | 0 | 0,04 | 0,0007955 | 0,00 | 0,00 |
| 461 | 2.098 | 2024 | Offices | 26,000 | Number of employees | Recycled paper | 100,000 | 0,000 | 0,000 | 0,101 | 0 | 0,10 | 0,0038846 | 0,00 | 0,10 |
| 462 | 2.098 | 2024 | Offices | 26,000 | Number of employees | White paper | 0,000 | 0,000 | 0,000 | 0,000 | 0 | 0,00 | 0,0000000 | 0,00 | 0,00 |
| 463 | 2.098 | 2024 | Factory | 41,000 | Number of employees | Recycled paper | 100,000 | 0,000 | 0,000 | 0,211 | 0 | 0,21 | 0,0051463 | 0,00 | 0,21 |
| 464 | 2.098 | 2024 | Factory | 41,000 | Number of employees | White paper | 0,000 | 0,000 | 0,000 | 0,116 | 0 | 0,12 | 0,0028293 | 0,00 | 0,00 |
| wdt_ID | Year | Center | Type of Materials | ||||||||||||
| ∑ = 458,000 |
 |
Biodiversity |
Biodiversity indicators
With regard to land use, an indicator of biodiversity, ADAMA considers that it is not a relevant indicator for the organization's direct environmental aspects, since, for the following reasons, the built area of its centers has no direct relationship with the organization's production or turnover: Consequently, without changing the built area from one year to the next, we may find large variations in the "occupied area/annual production" or "occupied area/annual turnover" indicator, without having taken any deliberate action.
| wdt_ID | userid | post_author | Year | Center | Units Pr. | Units | Total land use (m2) | Sealed surface area (m²) | Unsealed area (m2) | Land use / nature | Area oriented according to nature at the site (m²) | Non-central area oriented according to nature (m²) | Usage ratio (m2)/Udp. | Sealed ratio (m2)/Udp. | Unsealed Ratio (m2/Udp) | Targeted ratio (m2)/Udp. | Off-center ratio (m2)/Udp. |
|---|---|---|---|---|---|---|---|---|---|---|---|---|---|---|---|---|---|
| 126 | 2.098 | 2.098 | 2022 | Offices | 36,000 | Number of employees | 816 | 816 | 0 | 0 | 0 | 22,6667 | 22,6667 | 0,0000 | 0,0000 | 0,000 | |
| 127 | 2.098 | 2.098 | 2023 | Offices | 36,000 | Number of employees | 816 | 816 | 0 | 0 | 0 | 22,6667 | 22,6667 | 0,0000 | 0,0000 | 0,000 | |
| 128 | 2.098 | 2.098 | 2024 | Offices | 26,000 | Number of employees | 816 | 816 | 0 | 0 | 0 | 31,3846 | 31,3846 | 0,0000 | 0,0000 | 0,000 | |
| 129 | 2.098 | 2.098 | 2022 | Factory | 15.078,000 | Tons produced | 24.430 | 19.194 | 5.152 | 84 | 127 | 1,6202 | 1,2730 | 0,3417 | 0,0056 | 0,008 | |
| 130 | 2.098 | 2.098 | 2023 | Factory | 14.619,000 | Tons produced | 24.430 | 19.194 | 5.152 | 84 | 127 | 1,6711 | 1,3129 | 0,3524 | 0,0057 | 0,009 | |
| 131 | 2.098 | 2.098 | 2024 | Factory | 10.383,000 | Tons produced | 24.430 | 19.194 | 5.152 | 84 | 127 | 2,3529 | 1,8486 | 0,4962 | 0,0081 | 0,012 | |
| Year | Center |
 |
Other information of environmental interest |
Indicators and impacts
The European Commission prepares sectoral reference documents, in consultation with member states and other stakeholders, which include best environmental practices and indicators for specific sectors. These documents serve as guidelines for improving the environmental performance of certain sectors. However, as there is no Sectoral Reference Document (SRD) for our activity, no comparison is made with these documents, but rather with the environmental performance of previous years.
Notwithstanding the above, we report on some relevant indicators below.

 |
Environmental aspects and impacts |
Environmental aspects and impacts
The organization identifies and evaluates the elements of its activities, products, and services that interact or may interact with the environment, generating environmental impacts. The management of these aspects is a fundamental part of ADAMA's Integrated Quality, Environment, Major Accidents, and Occupational Health and Safety Management System (QASAG). The identification and evaluation of direct environmental aspects, under normal operating conditions, are quantitatively assessed according to criteria such as the nature of the aspect, the characteristics of the receiving environment, and its magnitude. For emergency or abnormal situations, the assessment considers the probability, severity of consequences, and existing control guidelines. A limited number of aspects are determined to be "significant" based on their score and relevance. Our organization also considers indirect environmental aspects, which are those impacts over which the company does not have complete control, generated by third parties such as contractors, transporters, or customers, or related to the life cycle of its products. These include emissions, spills, and waste at external facilities, transport accidents, or waste generated by customers (such as packaging). ADAMA attempts to influence these aspects through the approval and monitoring of suppliers and subcontractors, and by managing the end of life of its packaging through adherence to systems such as SIGFITO and ECOEMBES, participating in prevention plans, and contributing to the collection and management of empty packaging waste.

Description of the most important and significant environmental aspects
The significant environmental aspects for 2025 encompass industrial, office, and commercial activities, thereby improving the assessment and highlighting the aspects of each type of work and workplace independently. As with the significant environmental aspects for 2024, in order to apply the procedure correctly, we have carried out the same analysis for 2025, with the results shown in the following table.
Description of significant environmental aspects
Thus, within the annual improvement plan (see chapter on the 2025 program review), the following objectives have been set for 2025. Some of these objectives are similar to or have been maintained in relation to those already established in 2019, while others are new due to the emergence of significant new direct environmental aspects or the impossibility of continuing to improve this indicator with the techniques implemented in the organization:
-10% reduction in water consumption per ton produced
-10% reduction in energy consumption per ton produced from non-renewable sources
-Reduction in Hazardous waste generation by Hazardous per ton produced
-Reduction in environmental operating costs by 2%
These objectives will be compared with both relative and absolute values based on the records generated in 2024, as has been done to date. In addition, other objectives are proposed within the management system, but they are not closely related to environmental aspects or form part of other programs such as the Waste Minimization Plan or the Corporate Prevention Plan, which support these objectives as actions to be developed or improved.
| wdt_ID | state | userid | Year | Center | Life Cycle Phase | Environmental Aspect | Impact | Typology | Process | udimpact | Actions | Analysis | Significant | ID | post_author |
|---|---|---|---|---|---|---|---|---|---|---|---|---|---|---|---|
| 1.282 | VALIDATED | 2.098 | 2024 | Factory | Production | Water consumption: Water consumption (Humanes) | RESOURCE DEPLETION | Direct/Normal | Industrial activity | Yes | 129.657 | 2.098 | |||
| 1.283 | VALIDATED | 2.098 | 2024 | Offices | Production | Energy use / Air emissions / Raw material consumption: Diesel fuel for company vehicles / Associated CO2 emissions (Príncipe de Vergara) | RESOURCE DEPLETION, AIR POLLUTION | Direct/Normal | Commercial / sales / management | Yes | 129.657 | 2.098 | |||
| 1.284 | VALIDATED | 2.098 | 2024 | Factory | Production | Energy Use / Air Emissions Diesel fuel for company forklifts (Humanes) | AIR POLLUTION | Direct/Normal | Industrial activity | Yes | 129.657 | 2.098 | |||
| 1.285 | VALIDATED | 2.098 | 2024 | Factory | Production | Hazardous Waste Generation: Empty pesticide containers (cardboard, paper, compressed contaminated plastic) | SOIL DISTURBANCE, WATER DISTURBANCE | Direct/Normal | Industrial activity | Yes | 129.657 | 2.098 | |||
| 1.286 | VALIDATED | 2.098 | 2024 | Factory | Production | Hazardous Waste Generation: Empty laboratory containers (small glass containers) | WATER DISTURBANCE | Direct/Normal | Industrial activity | Yes | 129.657 | 2.098 | |||
| 1.287 | VALIDATED | 2.098 | 2024 | Factory | Production | Hazardous Waste Generation: Expired Pesticides | SOIL DISTURBANCE, WATER DISTURBANCE | Direct/Normal | Industrial activity | Yes | 129.657 | 2.098 | |||
| 1.288 | VALIDATED | 2.098 | 2024 | Factory | Production | Hazardous Waste Generation: Manhole Waste | SOIL DISTURBANCE, WATER DISTURBANCE | Direct/Normal | Industrial activity | Yes | 129.657 | 2.098 | |||
| 1.289 | VALIDATED | 2.098 | 2024 | Factory | Production | Generation of Hazardous waste: Absorbents contaminated with pesticides | SOIL DISTURBANCE, WATER DISTURBANCE | Direct/Normal | Industrial activity | Yes | 129.657 | 2.098 | |||
| 1.290 | VALIDATED | 2.098 | 2024 | Factory | Production | Hazardous Waste Generation: Activated Carbon Filters | SOIL DISTURBANCE, WATER DISTURBANCE | Direct/Normal | Industrial activity | Yes | 129.657 | 2.098 | |||
| 1.291 | VALIDATED | 2.098 | 2024 | Factory | Production | Generation of Hazardous waste: wash water | SOIL DISTURBANCE, WATER DISTURBANCE | Direct/Normal | Industrial activity | Yes | 129.657 | 2.098 | |||
| 1.292 | VALIDATED | 2.098 | 2024 | Factory | Production | Hazardous waste generation: Wooden pallets | RESOURCE DEPLETION | Direct/Normal | Industrial activity | Yes | 129.657 | 2.098 | |||
| 1.293 | VALIDATED | 2.098 | 2024 | Factory | Production | Consumption of raw materials and natural resources: Paper consumption | RESOURCE DEPLETION | Direct/Normal | Office activity | Yes | 129.657 | 2.098 | |||
| 1.294 | VALIDATED | 2.098 | 2024 | Factory | Production | Consumption of raw materials and natural resources / Energy use / Air emissions Diesel fuel: Raw materials and finished product | SOIL CONTAMINATION, WATER CONTAMINATION, GENERATION OF Hazardous WASTE, GENERATION OF Hazardous WASTE | Direct/Normal | Industrial activity | Yes | 129.657 | 2.098 | |||
| 1.295 | VALIDATED | 2.098 | 2024 | Factory | Production | Process water discharge: Process water management by a waste manager | SOIL CONTAMINATION, WATER CONTAMINATION, GENERATION OF Hazardous WASTE, GENERATION OF Hazardous WASTE | Direct/Normal | Industrial activity | Yes | 129.657 | 2.098 | |||
| 1.296 | VALIDATED | 2.098 | 2024 | Factory | Production | Hazardous waste Hazardous from a fire at a warehouse storing flammable products that was accidentally spilled | SOIL CONTAMINATION, WATER CONTAMINATION, AIR POLLUTION, GENERATION OF Hazardous WASTE, GENERATION OF Hazardous WASTE | Direct/Abnormal | Industrial activity | Yes | 129.657 | 2.098 | |||
| 1.297 | VALIDATED | 2.098 | 2024 | Offices | Production | Waste from an office fire in Madrid | WATER POLLUTION, AIR POLLUTION, Hazardous WASTE GENERATION, Hazardous WASTE GENERATION | Direct/Abnormal | Office activity | Yes | 129.657 | 2.098 | |||
| 1.298 | VALIDATED | 2.098 | 2024 | Factory | Production | Emissions resulting from a fire in a warehouse storing flammable products or accidental spillage | AIR POLLUTION | Direct/Abnormal | Industrial activity | Yes | 129.657 | 2.098 | |||
| 1.299 | VALIDATED | 2.098 | 2024 | Factory | Production | Discharge/channeling of hazardous wastewater from extinguishing a fire in the flammable products warehouse/accidental discharge | SOIL DISTURBANCE, WATER DISTURBANCE | Direct/Abnormal | Industrial activity | Yes | 129.657 | 2.098 | |||
| 1.300 | VALIDATED | 2.098 | 2024 | Offices | Production | Emissions resulting from a fire in offices in Madrid | AIR POLLUTION | Direct/Abnormal | Office activity | Yes | 129.657 | 2.098 | |||
| 1.301 | VALIDATED | 2.098 | 2024 | Offices | Production | Discharge/channeling of wastewater resulting from a fire in offices in Madrid | WATER DISTURBANCE | Direct/Abnormal | Office activity | Yes | 129.657 | 2.098 | |||
| 1.302 | VALIDATED | 2.098 | 2024 | Offices | Production | Waste resulting from a traffic accident, including vehicle fire | WATER POLLUTION, AIR POLLUTION, Hazardous WASTE GENERATION, Hazardous WASTE GENERATION | Direct/Abnormal | Commercial activity | Yes | 129.657 | 2.098 | |||
| 1.303 | VALIDATED | 2.098 | 2024 | General/Cooperative | Product use | • Emissions, discharges, and waste generated at third-party facilities that handle ADAMA products, both through subcontracted activities and through the application of its products. | WATER POLLUTION, AIR POLLUTION, Hazardous WASTE GENERATION, Hazardous WASTE GENERATION | Indirect | Commercial activity | Yes | 129.657 | 2.098 | |||
| 1.304 | VALIDATED | 2.098 | 2024 | General/Cooperative | Product use | • Emissions, spills, and waste resulting from accidents during the handling, transport, and/or application of ADAMA products. | WATER POLLUTION, AIR POLLUTION, Hazardous WASTE GENERATION, Hazardous WASTE GENERATION | Indirect | Commercial activity | Yes | 129.657 | 2.098 | |||
| 1.305 | VALIDATED | 2.098 | 2024 | General/Cooperative | Product use | • Emissions generated by transporters / air pollution | AIR POLLUTION | Indirect | Commercial activity | Yes | 129.657 | 2.098 | |||
| 1.306 | VALIDATED | 2.098 | 2024 | General/Cooperative | Product use | • Waste generated by transporters / air pollution | Waste Generation ( Hazardous), Waste Generation ( Hazardous) | Indirect | Commercial activity | Yes | 129.657 | 2.098 | |||
| 1.307 | VALIDATED | 2.098 | 2024 | General/Cooperative | Product use | • Emissions, discharges, and waste generated by maintenance operations carried out by external companies on premises owned by ADAMA. | WATER POLLUTION, AIR POLLUTION, Hazardous WASTE GENERATION, Hazardous WASTE GENERATION | Indirect | Commercial activity | Yes | 129.657 | 2.098 | |||
| 1.308 | VALIDATED | 2.098 | 2024 | General/Cooperative | Product use | Waste generated at customer sites / water and soil pollution due to the large amount of packaging generated because of the size of the product packaging. | WATER POLLUTION, AIR POLLUTION, Hazardous WASTE GENERATION, Hazardous WASTE GENERATION | Indirect | Commercial activity | Yes | 129.657 | 2.098 | |||
| 1.309 | VALIDATED | 2.098 | 2024 | General/Cooperative | Product use | Energy consumption resulting from the subcontractor's own activities at its facilities. | RESOURCE DEPLETION | Indirect | Commercial activity | Yes | 129.657 | 2.098 | |||
 |
Environmental improvement planning |
Target Planning
The environmental management program is implicit in the annual Continuous Improvement Plan and is a result of the assessment of identified environmental aspects. The objectives defined in this Plan relate to those significant environmental aspects identified in the annual assessment for which the Organization believes it can take action to improve, prioritizing them from most to least serious. ADAMA's commitment to Continuous Improvement is reflected, among other objectives, in carrying out its activities while protecting the environment in which it operates through increasingly better control of possible aspects that could have a negative impact on that environment.

Environmental improvement planning
Within the company's management program for the period 2019–2024, the following specific environmental improvement objectives were identified and monitored in 2024:
The planned improvement targets are shown below (2019 – 2024)
| userid | Year | Center | wdt_ID | Life Cycle Phase | Objective | Target Value | Value reached | % Achieved | Goal / Action | Impact/Associated Impact | Department / Resource | Deadline | Remarks | post_author |
|---|---|---|---|---|---|---|---|---|---|---|---|---|---|---|
| 2.098 | 2024 | Factory | 422 | PRODUCTION | OBJECTIVE 1: Reduce the amount of waste produced in Humanes by 15% (kg of waste/ton of production) compared to 2019. | 15,000 | 0,000 | 0,0 | Identification of non-recyclable waste at the plant. Search for treatment alternatives. Review of current segregation Audits/visits to waste managers. Implementation of new CT and NT as appropriate Search for a waste return system (SCRAP) for integrated management. |
Waste | Factory Manager / EHSQ | 31/12/2024 | The relative target of a 15% reduction in waste generation has not been achieved. | 2.098 |
| 2.098 | 2024 | Factory | 423 | PRODUCTION | OBJECTIVE 2: Reduce water consumption in Humanes by 10% (m³/ton of production) compared to 2019. | 10,000 | 0,000 | 0,0 | -Approval of Capex 2023 and 2024 meters. Implementation of meters in pilot plant. Monitoring of consumption by plant Analysis of the sources of highest consumption Search for alternatives to reduce consumption Improvement of process efficiency. |
Consumption of natural resources | Factory Manager / EHSQ | 31/12/2024 | The objective has not been achieved. | 2.098 |
| 2.098 | 2024 | PPV Factory-Offices | 424 | PRODUCTION | OBJECTIVE 3: Reduce office supply consumption by 10%, taking into account the new indicators incorporated in 2022. | 10,000 | 0,000 | 0,0 | Incorporate the indicators defined by CAM into procedures. Track office supply invoices to establish a baseline. Conduct an analysis by employee. Search to reduce consumption |
Generation of packaging waste/consumption of natural resources | Chief Executive Officer / EHSQ | 31/12/2024 | The objective has not been achieved. | 2.098 |
| 2.098 | 2024 | PPV Factory-Offices | 425 | PRODUCTION | GOAL 4: Reduce energy consumption from fossil fuels by 10% compared to 2019. | 10,000 | 0,000 | 0,0 | Completion of energy audit actions Review of installation equipment and consumption (NIRI) Analysis of improvements to be proposed for CAPEX 2024 Include improvements in CAPEX 2024 Search for less polluting forklift alternatives. Search for eco-friendly or less polluting company cars Installation of solar panels. Capex, project implementation, legalization of the installation. |
Emissions into the atmosphere / consumption of resources | Chief Executive Officer / EHSQ | 31/12/2024 | The objective has not been achieved. | 2.098 |
| 2.098 | 2024 | Factory | 426 | PRODUCTION | THREE-YEAR IMPROVEMENT 2024-2026: Conducting a HAZOP study on auxiliary facilities. | 1,000 | 25,000 | 25,0 | • Supplier/offer search • Initial process diagnosis • Project implementation • Monitoring of associated actions |
Potential environmental aspects | Factory Manager | December 31, 2026 | 25% pending for 2025 and 2026 for the rest of the auxiliary facilities. Planned. | 2.098 |
| 2.098 | 2024 | PPV Factory-Offices | 427 | PRODUCTION | IMPROVEMENT 2: Incorporate Office indicators and graphs into the report. | 1,000 | 1,000 | 100,0 | Incorporate office indicators into the EMAS report • Annual cost of office consumables purchased per full-time equivalent (FTE) employee (EUR/FTE/year). • Paper consumed in the office for administrative tasks. Total and per employee. • Paper consumed / recycled paper* |
Consumption of natural resources | CEO / QEHS / Factory Management | 31/12/2024 | New charts related to office supply fuel consumption are included. | 2.098 |
| 2.098 | 2024 | Factory | 428 | PRODUCTION | IMPROVEMENT 3: Implementation of new procedures related to environmental management and process safety. | 1,000 | 0,800 | 80,0 | • Review of current procedures • Adaptation of new procedures • Communication and implementation of new procedures • Monitoring of compliance |
All environmental vectors are involved. | Factory Manager / EHSQ | 31/12/2024 | All procedures related to the environment have been reviewed, and compliance and implementation is over 80%. Achieved. | 2.098 |
| 2.098 | 2024 | Factory | 429 | PRODUCTION | IMPROVEMENT 4: Improve control of energy and water consumption to increase process efficiency. | 1,000 | 0,000 | 0,0 | • Identification of needs • Search/negotiation with supplier (authorization and approval) • Decision and implementation • Verification of compliance with legal requirements |
All environmental vectors are involved. | Factory Manager / EHSQ | 31/12/2024 | Installation in a single packaging plant as a pilot project. It is proposed to install these systems in the rest of the plants and link the machines so that they shut down automatically and reduce consumption. | 2.098 |
| 2.098 | 2025 | Factory | 430 | PRODUCTION | GOAL 1: Reduce the amount of Hazardous waste Hazardous in Humanes by 15% (kg of waste per ton of production) by 2024 | 15,000 | 0,000 | 0,0 | Identification of non-recyclable waste at the plant. Search for treatment alternatives. Review of current segregation Audits/visits to waste managers. Creation of new CT and NT as appropriate Search for a waste return system (SCRAP) for integrated management. Implementation of actions to reduce generation |
Waste | Factory Manager / EHSQ | 31/12/2025 | FUTURE IMPLEMENTATION. | 2.098 |
| 2.098 | 2025 | Factory | 431 | PRODUCTION | OBJECTIVE 2: Reduce water consumption in Humanes (m³/ton of production) by 5% compared to 2024 and the generation of wash water. | 5,000 | 0,000 | 0,0 | -Approval of Capex 2023 meters. Implementation of meters in pilot plant. Monitoring of consumption by plant Analysis of the sources of highest consumption Search for alternatives to reduce consumption Improvement of process efficiency and employee awareness. Automation of washing lines and processes. |
Waste | Factory Manager / EHSQ | 31/12/2025 | FUTURE IMPLEMENTATION. | 2.098 |
| 2.098 | 2025 | PPV Factory-Offices | 432 | PRODUCTION | OBJECTIVE 3: Reduce office supply consumption by 10%, taking into account the new indicators incorporated in 2022. | 10,000 | 0,000 | 0,0 | Incorporate the indicators defined by CAM into procedures. Track office supply invoices to establish a baseline. Conduct an analysis by employee. Search to reduce consumption |
Generation of packaging waste/consumption of natural resources | Chief Executive Officer / EHSQ | 31/12/2025 | FUTURE IMPLEMENTATION. | 2.098 |
| 2.098 | 2025 | PPV Factory-Offices | 433 | PRODUCTION | GOAL 4: Reduce energy consumption from both electricity and fossil fuels by 10% by 2024 (Production and Offices) | 10,000 | 0,000 | 0,0 | Completion of energy audit actions Review of installation equipment and consumption (NIRI) Analysis of improvements to be proposed for CAPEX 2024 Include improvements in CAPEX 2024 Search for less polluting forklift alternatives. Search for eco-friendly or less polluting company cars Installation of solar panels. Capex, project implementation, legalization of the installation. |
Emissions into the atmosphere / consumption of resources | Chief Executive Officer / EHSQ | 31/12/2025 | FUTURE IMPLEMENTATION. | 2.098 |
| 2.098 | 2025 | PPV Factory-Offices | 434 | PRODUCTION | GOAL 5: Reduce CO2 emissions by 10% compared to 2024 (Production and Offices) | 10,000 | 0,000 | 0,0 | Completion of energy audit actions Review of installation equipment and consumption (NIRI) Analysis of improvements to be proposed for CAPEX 2024 Include improvements in CAPEX 2024 Search for less polluting forklift alternatives. Search for eco-friendly or less polluting company cars Installation of solar panels. Capex, project implementation, legalization of the installation. |
Emissions into the atmosphere / consumption of resources | Chief Executive Officer / EHSQ | 31/12/2025 | FUTURE IMPLEMENTATION. | 2.098 |
| 2.098 | 2025 | Factory | 435 | PRODUCTION | IMPROVEMENT 1: Conducting a HAZOP study on auxiliary facilities. | 1,000 | 0,000 | 0,0 | • Supplier/offer search • Initial process diagnosis • Project implementation • Follow-up on related actions |
Potential environmental aspects | Factory Manager | 31/12/2025 | FUTURE IMPLEMENTATION. | 2.098 |
| 2.098 | 2025 | Factory | 436 | PRODUCTION | IMPROVEMENT 2: Improve control of energy and water consumption to increase process efficiency. | 1,000 | 0,000 | 0,0 | • Detection of needs • Search/negotiation with supplier (authorization and approval) • Decision and implementation • Verification of compliance with legal requirements • Implementation of pilot control systems in all packaging plants. |
Potential electricity and water consumption | Factory Manager / EHSQ | 31/12/2025 | FUTURE IMPLEMENTATION. | 2.098 |
| 2.098 | 2025 | Factory | 437 | PRODUCTION | IMPROVEMENT 3: Reduction in non-renewable energy consumption from the grid through the installation of self-consumption panels. | 1,000 | 0,000 | 0,0 | • Detection of needs • Search/negotiation with supplier (authorization and approval) • Decision and implementation • Verification of compliance with legal requirements • Implementation of photovoltaic systems for self-consumption energy generation |
Potential electricity and water consumption | Factory Manager / EHSQ | 31/12/2025 | FUTURE IMPLEMENTATION. | 2.098 |
| 2.098 | 2025 | Factory | 438 | PRODUCTION | IMPROVEMENT 4: Reduction in the production of plastic spring-loaded packaging. | 1,000 | 0,000 | 0,0 | • Detection of needs • Search/negotiation with supplier (authorization and approval) • Decision and implementation • Verification of compliance with legal requirements • Assessment of the change from 200-liter drums to IBCs in the supply. |
Potential electricity and water consumption | Factory Manager / EHSQ | 31/12/2025 | FUTURE IMPLEMENTATION. | 2.098 |
| 2.098 | 2025 | PPV Offices | 439 | PRODUCTION | IMPROVEMENT 5: Modification of the company car policy | 1,000 | 0,000 | 0,0 | • Identification of needs • Search/negotiation with supplier (authorization and approval) • Decision and implementation • Verification of compliance with legal requirements • Modification of the policy to include only cars with ECO or 0 labels in the selection options. |
Potential diesel consumption | Chief Executive Officer / People / EHSQ | 31/12/2025 | FUTURE IMPLEMENTATION. | 2.098 |
 |
Legal compliance analysis |
Legal and regulatory compliance
The organization has a procedure and system for the identification of legal requirements, as well as for periodic evaluation to ensure full compliance. The following is a list of current environmental permits and/or authorizations, as well as a summary of their validity.
ADAMA AGRICULTURE SPAIN maintains an integrated management system to ensure legal compliance with environmental regulations in its activities. It reviews the regulations published in official gazettes (DOCE, BOE, and BOCAM) on a daily basis, in addition to receiving sector-specific information. It uses specific software to monitor these requirements and also incorporates other commitments such as corporate requirements and those related to social responsibility, customers, and suppliers.

List of permits, authorizations and declarations in force
1. Waste
ADAMA is authorized as a waste producer for both the Humanes center and the Madrid offices. Since 2002, it has been a member of the SIGFITO comprehensive packaging waste system, and since 2012, it has been a member of ECOEMBES.
In addition, it submits an annual Packaging Declaration and periodically submits its Waste Minimization Plan, which is due to be updated in 2024.
2. Waste disposal
The factory has had a municipal industrial identification number since February 1996. ADAMA is not required to obtain a waste disposal permit, as this is not necessary for its activity.
3. Emissions
Several actions have been taken with regard to emissions control:
- In July 2020, report MC0703F0120200506 on internal gas and particle control was submitted, together with report MDMAI8101086128 CATM001722 on the implementation of focus No. 10.
- In March 2022, new measurements were taken, as recorded in report MD/MAI-8103051348 C/ATM/003509, relating to pre-existing systematic hotspots.
- In February 2023 and November 2023, emission checks were carried out, documented in reports MD/MAI-8104039505 C/ATM/004720 and No. 28-28-M01-2-020119, respectively.
4. Other legal requirements and actions
ADAMA has the corresponding Activity License for both its headquarters in Madrid and its factory in Humanes. The Community of Madrid has announced that the factory is not included in the requirements of the IPPC Directive. With regard to energy efficiency, the audit required by Royal Decree 56/2016 has been carried out, with the next update scheduled for 2024.
Regarding environmental risk control:
Since December 2017, an annual inspection has been carried out to verify compliance with Royal Decree 840/2015 on the control of serious accidents involving hazardous substances, with satisfactory results to date (2018-2023).
In September 2018, an Environmental Risk Analysis was prepared in accordance with Law 26/2007 on Environmental Responsibility, formalizing a Responsible Declaration before the Regional Ministry of the Environment (CAM) to comply with Order APM 1040/2017. Although the entity was exempt from providing financial guarantees, as a matter of good practice, it maintains a specific insurance policy with environmental coverage.
In January 2024, the Environmental Risk Analysis was updated, incorporating organizational changes and renewing the specific insurance policy.
Regulatory Compliance Summary
It conducts annual internal and external audits with specialized companies to verify legal compliance. In 2023, ADAMA detected a one-time breach: it exceeded the authorized extraction volume in well No. 2 due to a calculation error. To resolve this, it has installed new meters and an electronic system that will automatically stop extraction when the permitted limit is reached. All other applicable legal requirements were satisfactorily met.
The administrative authorization for emissions in Humanes de Madrid is currently being processed. This was requested in May 2015 (with the project verified by OCA). In January 2020, a favorable administrative resolution was received authorizing the sources. In June 2020, an update to the administrative resolution in question was requested in order to expand its scope to include a new source at our SC non-herbicide plant. We are currently awaiting a response.
◉ Verification record
This Digital Environmental Statement is being verified by:
ES-V-0001 – AENOR
The most valid document, or in case of discrepancies, will be the PDF digitally signed by the verifying body. This document is a true reflection and representation of this Digital Environmental Declaration or rendered web page. Interested parties may download this rendering here as proof and evidence of the invariability and consistency of the data validated in this DIGITAL ENVIRONMENTAL DECLARATION.
Date of lastedit: – Render version File No.: 0 VALIDATION PHASE
ORGANIZATION: ADAMA AGRICULTURE SPAIN S.A. – CENTER(S) – COVERAGE: ADAMA
ACCESS TO THE EUROPEAN REGISTRY: EUROPEAN COMMISSION
TRANSLATIONS OF THIS ENVIRONMENTAL STATEMENT: This EMAS Environmental Statement has been verified in its original language. The browsers used by stakeholders for consultation, or the Platform RightSupply itself, may automatically translate its direct transcription, without the certifying body considering its translated content as validated a priori. Methods such as sworn translation are recommended for this purpose.
EXTERNAL LINKS AND AUDIOVISUAL CONTENT: This EMAS Environmental Statement has been verified in its entirety, with the exception of external links and audiovisual or videographic content that may have been included for complementary purposes.
DIGITALIZATION: Digitization of environmental statements is a best practice with multiple sustainability benefits. By eliminating the use of paper, a significant reduction in energy and water consumption is achieved, which in turn minimizes the carbon footprint. This digital transition not only supports the environment, but also improves data accuracy and consistency, optimizing management efficiency, environmental reporting and access to information for stakeholders. This initiative was recognized as a best practice in 2022 within the European Union's INTERREG EUROPE public policy program (ENHANCE EMAS), underlining its importance in promoting a greener and more efficient administration across Europe.
Template: 2026 Final