








Environmental Statement
EMAS STATEMENT REPORTING PLATFORM

Environmental Statement
EMAS EUROPEAN REGULATIONS

Environmental Statement
EMAS STATEMENT REPORTING PLATFORM
GRUPO CEMENTOS PORTLAND VALDERRIVAS:
EL ALTO MORATA DE TAJUÑA FACTORY
Annex IV.B Environmental statement
- A summary of the organisation's activities, products and services, the organisation's relationship to central organisations, if applicable, and a clear and unambiguous description of the scope of the EMAS registration, including a list of the sites included in this registration;
 |
General data |
Introductory Presentation
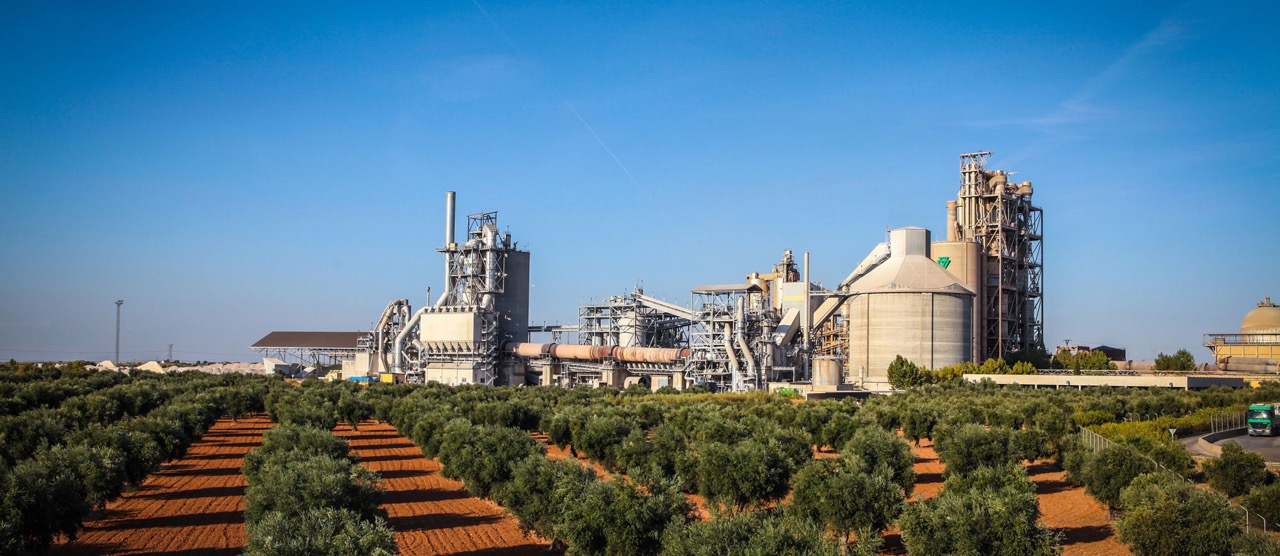
At this link, we present the Environmental Statement for the El Alto Plant, part of Grupo Cementos Portland Valderrivas, prepared in accordance with the EMAS Regulation. This is the first such statement we have published in a 100% online and digital format. The goal is to provide our stakeholders with all the necessary information regarding the environmental aspects and activities relevant to our operations, including limestone quarrying and the production of clinker, cement, and mortar.
The Grupo Cementos Portland Valderrivas in the cement industry based on a commitment to sustainable development, with an Environmental and Energy Management System (based on ISO 14001:2015 and ISO 50001:2018 standards) that takes into account the plant’s context through a risk- and opportunity-based approach, applying a life-cycle approach to the manufactured products that includes:
Planning of actions to control risks associated with environmental aspects and context analysis.
Compliance with applicable requirements and performance evaluation
Environmental improvement plans
Action planning for the control of stakeholders' needs and expectations.
This Statement provides an update on the performance results for quantitative indicators related to environmental management aspects achieved in 2025: consumption of raw materials, fuels, electricity, and water; Recovery ; emissions to air, soil, and water; biodiversity initiatives; and environmental emergencies.
Priority is given to indicators and results, summarizing environmental performance compared to previous Statements to highlight improvements. The entire content of the Environmental Statement has been reviewed by management and independently validated by AENOR (the certificate is included at the end of the document).
 |
2025 |
 Centre/s
2
 Workers
146
 Surface
611.500 m2
 Activity in
t Product manufactured
Total production: 931,546 metric tons.
Unit Ref: Gray + white cement production / Dry mortar production / Gray and white clinker shipment
Our organisation presents this validated Environmental Statement as part of our commitment to transparency and environmental improvement of our activities, operations and facilities.
LOCATION- MAIN CENTER
|
Description of the activity |
Activities and scope of the Environmental Statement
The Grupo Cementos Portland Valderrivas is an industrial group owned by Cementos Portland Valderrivas, S.A., which owns the El Alto plant. The company is part of an industrial group with a significant mining component that operates across the entire construction business cycle. The group consists of several companies and has a presence in Spain—with seven cement plants located throughout the country—as well as in Tunisia. Its environmental organization is based on a functional hierarchy between the Corporate Divisions and the Operational and Business Responsibility Divisions. Our organization presents this validated Environmental Statement as part of our commitment to transparency and environmental improvement in our activities, operations, and facilities. The "El Alto" Plant, located in the municipality of Morata de Tajuña in Madrid, has its origins in the Portland Valderrivas Company, which in 1970 decided to build a new cement plant as an expansion of the Vicálvaro Plant, which had been in operation since the 1930s. Its operations are classified under NACE code 2351 for cement production, NACE 0811 for stone quarrying, and NACE 2364 for the manufacture of dry mortar. The El Alto plant has been in continuous operation since 1972, when installation work was completed and dry-process clinker production began. It currently consists of two gray cement lines, one white cement line, and a dry mortar production facility, making El Alto the largest facility in the industry in Spain in terms of production capacity. The plant covers an area of 611,500 m², which includes the fenced-in premises and the outdoor vehicle checkpoint area. Plant and Quarry Location: M-311 Highway, Km 4.5, 28530 Morata de Tajuña (Madrid) Phone: 91-8740600 / Fax: 91-8739055 CIF NIF A-31000268


The digitization of Environmental Declarations not only contributes to reducing environmental impact by eliminating the need for printing, but also increases the accuracy and consistency of data, improving management efficiency, environmental reporting and access to information by stakeholders. This platform has been recognized as a best practice under the European Union's INTERREG EUROPE public policy program (ENHANCE EMAS). Ref. RightSupply.net (Ecomundis)
|
Environmental management and governance approach |
Description of the Environmental Management System
In order to ensure compliance with business objectives, the Grupo Cementos Portland Valderrivas and, therefore, its factories in Spain, has established as a tool the Environmental and Energy Management System, adapted to the characteristics, particularities and needs of the organization and facilities, and inspired by the concepts that define continuous improvement. The management system implemented is in accordance with the international standard UNE-EN ISO 14001, adopted since 2002, and with the European Regulation 1221/2009 (EMAS III), modified by Regulation 1505/2017 and Regulation 2026/2018 -the latter registered in 2007 with code ES-MD-000203. This management system, the audits and the revisions that the Management has made of it, allow us to maintain a dynamic of environmental management, always having as basic principles: Inspired by the philosophy of continuous improvement, it will be subject to the P-E-V-O cycle (Plan - Execute - Verify - Optimize), and is supported by documents such as the Manual and General Procedures that respond to its interaction with the Corporate Departments and common between factories; as well as specific ones that collect the particular operation and adapted to the legal requirements of each facility. The organizational context of the El Alto plant is shaped by internal and external factors that influence the ability to achieve the objectives of the Environmental Management System. External factors are primarily grouped into: the needs and expectations of external stakeholders, geographic location, market conditions, economic conditions, legal and other applicable requirements, and others. Internal factors, meanwhile, include—in addition to internal stakeholders—aspects of the corporate group, environmental aspects, the production process itself, technological changes, management practices, and others. The analysis of risks and opportunities is conducted by evaluating qualitative or quantitative criteria. In the case of risks associated with environmental aspects and legal requirements, quantitative criteria are preferred, to the extent possible. Risks and opportunities are identified following the assessment of environmental aspects, verification of applicable legal requirements, and definition of the context and the expectations and needs of interested parties. When qualitative criteria are used, efforts are made to ensure they are consistent and uniform, based on experience and knowledge of the specific context of each plant. By combining the probability and severity of the impact, risks are prioritized, and the type of preventive action to be taken is determined.
Organizational context
Determination of risks and opportunities
Location and contact
Address: Cementos Portland Valderrivas, Ctra. M-311 km. 4,5, 28530 Morata de Tajuña, Madrid - Tel: 918740500 - Mail: ernesto.ferrer@gcpv.com
Web: www.valderrivas.es
.
Main and secondary CNAE Code: 2351, 0811, 2364
|
Environmental policy |
Organizational Policy
Grupo Cementos Portland Valderrivas Environmental and Energy Policy, approved in May 2025 by the Director of Operations, is aligned with the UNE-EN ISO 14001:2015 and UNE-EN ISO 50001:2018 standards. It reflects the Group’s commitment to environmental protection and pollution prevention, taking into account the context of its activities. Its principles include: providing resources to meet environmental objectives and regulatory requirements, exceeding the legal minimum; promoting continuous improvement in facilities and environmental aspects using a life-cycle approach; establishing resource-backed plans for energy transition and decarbonization, aligned with sectoral, national, and international strategies; and integrating environmental and energy criteria into strategic planning, investments, and equipment procurement. Business success is linked to these sustainable practices.
- Resourcing
- Continuous improvement
- Energy transition and decarbonization
- Inclusion of environmental and energy considerations in strategic planning.
- Employee training and awareness
- Communication and outreach with stakeholders
- Energy efficiency
- Risk and opportunity management
- Fight against climate change
- Circular economy
- Water management
- Waste minimization
- Conservation of the environment
POLICY: Environmental and Energy Policy, May 2025
Mission
To develop, produce and market cement and construction materials, contributing to sustainable development, with special attention to safety and the environment, satisfying our shareholders, staff, customers and suppliers.
.
Vision
 |
Communication and participation |
Communication and stakeholder engagement
As in any business project, at the El Alto mill, stakeholder participation in the development of the business is an essential element. Thus, we try to disclose our activities in a clear and transparent way in order to be better known.
Internal communication
Internal communication has been discussed at the various meetings of the factory's Environmental Committee. The Environmental Delegates are informed of the development of the Environmental Surveillance Plan campaigns and environmental incidents. For the preparation of the environmental statement, the opinion of the workers' representatives is taken into account through the meetings of the Environmental Committee and in the communication actions carried out.
Throughout 2025, the information system on environmental management at the plant continues to provide updates on measurement campaign results, waste management, Recovery relevant environmental issues. Initiatives related to the El Alto plant are published in the magazine *Portland Contigo*.
Shareholders
The channels that ensure communication and dialogue between the Group and its shareholders are as follows:
- The General Shareholders' Meeting
- Specific call center service
- Specific e-mail: relaciones.inversores@gcpv.com
- The corporate website in its section aimed exclusively at shareholders
Employees
The satisfaction and motivation of the Group's human team is one of our greatest challenges.
We have developed different internal communication channels that provide our employees with continuous information on our activities while encouraging their participation and involvement in decision-making related to environmental issues:
- Suggestion boxes: allow direct communication of their environmental points of view, improvement, request for information, etc. and to which there is an obligation to respond by the company within a set period of time.
- Environmental Committees: These are regular meetings between Management and Department Heads and meetings with Operations Management to discuss common issues and establish strategies for action. Union delegates are invited to the factory committees.
- Training sessions: Established in accordance with the Annual Training Plan, these sessions serve as a two-way tool through which we convey information related to the field.
- Works Councils and Health and Safety Committees: channels through which employees can share their opinions and suggestions on issues such Recovery and improvements in risk prevention and environmental protection. Relevant information—whether arising from these committees or initiated by the Company and employees—is disseminated through meeting minutes and the bulletin board.
- Internet portal: in accordance with current legislation, the Group provides society with a corporate website www.valderrivas.es to comply with the requirements of the Transparency Law and the disclosure of environmental information.
- Portland Contigo Magazine: In June 2023 a new corporate publication "Portland Contigo" was created with the purpose of communicating the company's main news and milestones. Specifically, it includes articles and reviews of environmental and energy aspects of relevance to the Group.
Relevant environmental information—whether generated by environmental committees or promoted by the Company and its employees—is disseminated through information panels, personalized letters, and the bulletin board.
External communication
Suppliers, auxiliary industry and customers
It is our intention to advance in the commitment to extend our Environmental and Energy Policy to suppliers and contractors, making them participants in our environmental practices in order to work in an environmentally friendly way. In this sense, we provide them with instructions for action and ask our suppliers for information regarding their management, aware that the ultimate satisfaction of our customers' needs depends on the quality of the entire supply chain.
From the company, our efforts are focused on offering competitive and quality products through our Quality Management System according to UNE-EN-ISO 9.001, which ensures the coherence of our main commitment with our customers, developed within a framework of respect towards the environment. The communication channels established to satisfy the environmental information needs of these stakeholders are the Commercial Assistance Department and our Group's web page through the Customer Channel.
Public and private administrations
The El Alto factory collaborates with public and private institutions in the promotion of initiatives or projects of interest to the community through sponsorships, collaboration agreements, participation in conferences and other events.
Autonomous Administration. Continuous formal communications are maintained with the Autonomous Administration. Validated data on particle and gas emissions from the main emission sources are sent daily, as well as validated data from the automatic immission cabinets and the meteorological tower of the factory's air quality monitoring network. The integrated environmental authorization includes various reports on the environmental performance of the facility that must be reported each year. The same integrated environmental authorization contemplates the creation of an Air Quality Monitoring Commission, made up of the Department of the Environment, the Morata de Tajuña City Council and the company.
Local administration. Communications are regularly maintained with the Morata de Tajuña City Council given the high degree of importance that the El Alto factory has in the economic and social activity of this municipality. The most common communications of an environmental nature are those related to requests for licenses and authorizations for new facilities, as well as others of a legislative or informative nature.
Associations and business groups
Through the Group’s representatives, we at the factory interact with other business associations and groups in Spain and Europe. In this regard, our achievements have been shared for implementation by other companies in the sector through our participation in OFICEMEN, the Spanish Association of Cement Manufacturers; IECA (Spanish Institute of Cement and its Applications); and CEMENT EUROPE (formerly CEMBUREAU), the European Association of Cement Manufacturers—forums in which we present our process improvements and our management model.
Society in general
An essential element of our cultural tradition is the rootedness of our company in the territories in which we operate. For this reason, we develop a broader vision in our relationship with social agents and stakeholders in the communities, improving the channels of communication, dialogue and collaboration. Our factory is surrounded by a magnificent olive grove that produces cornicabra olives and, for years, the olive trees have been leased to local farmers, who pay a rent in exchange for maintaining them and using the olives to produce oil that is marketed throughout the region. An excellent virgin olive oil that passes all health controls.
With social organizations - neighborhood associations, environmentalists, universities, trade unions, among others - we are strengthening circles through a wide variety of actions, such as the financial support of the Passion at Easter in Morata de Tajuña, a unique festival.
In addition, during 2025, donations were made to the Morata de Tajuña City Council to help organize the Christmas and Holy Week celebrations, as well as to provide sports equipment; construction materials (bags of cement) were also donated.
Training sessions and guided tours of the facilities. Throughout 2025, numerous guided tours of the facilities were conducted for various stakeholder groups, such as schools, universities, and business associations. The information gathered through these interactions is used in the company’s operational practices to address, to the extent possible, the requirements and suggestions expressed by the various stakeholder groups.
Sustainability Reports
In accordance with the Grupo Cementos Portland Valderrivas 's Sustainability Reporting Guidelines, which constitute a balanced and reasonable presentation of the company's economic, environmental and social performance.
Environmental emergencies
Actual emergency situations and environmental drills make it possible to evaluate and update the implementation of the Emergency Plans designed for the factory and the quarry by the Occupational Risk Prevention Department, as well as the environmental accident management procedures defined within the Environmental Management System. These plans cover various emergency scenarios, the response plans for each one, and the teams responsible for carrying them out. In 2025, there were no environmental emergencies; however, an environmental drill was conducted simulating a hypothetical ammonia-contaminated water spill.
Dangerous goods are unloaded in accordance with the International Agreement concerning the Carriage of Dangerous Goods by Road - ADR. We have a Safety Advisor. We submit an annual report to the Competent Bodies.
Social information
Link here to our main social networks.
 |
 |
 |
 |
Environmental assessment and performance |
|
Key metrics |
◉ Global indicators 2025
Includes the sum of all the organisation's sites under the EMAS Register.
ENERGY CONSUMPTION

1,021,157.17MWh
• Renewable energy consumption : 24.37%
• Renewable generation:0%
WATER CONSUMPTION

191,804m³
• Water supply network0.124%
Source: Well | Stormwater
TOTAL DISCHARGES

0 m3
CO2 EMISSIONS

620,291 (ETS)metric tons
• Indirect: 1.724%
• Direct: 98.276%
WASTE

3,320.5metric tons
• Hazardous 0.57%
• Recovery 99.43%
Unit values on production/performance
1,096 MWh/t of manufactured product
0,2 m3/t Product manufactured
0 m3/t Product manufactured
0.66 Tn/t Manufactured product
0.00356 Tn/t Manufactured product
Unit Ref: t Product manufactured Gray + white cement production / Dry mortar production / Gray and white clinker shipment
|
Dimension of the activity |
Description of the main activity
The production process begins with the extraction, by blasting, crushing and storage, of limestone raw materials from a quarry, with a surface area altered since the beginning of the exploitation of about 2,355,000m2. The most relevant environmental impacts associated with quarrying are: visual impact, change in the morphology of the terrain, occupation of natural spaces, depletion of natural resources and impacts associated with quarrying, such as vibrations, noise and particle emissions, mainly. These previously homogenized limestones, together with other raw materials, give rise to raw meal, after an appropriate grinding and mixing process. This raw meal is heated to over 1,450 ºC using petroleum coke as the main fuel and RDF, NFVU, olive pomace and others as alternative fuels, in a horizontal rotary kiln and a cyclone tower, giving rise to the intermediate product clinker, consisting mainly of calcium silicates, which are responsible for the irreversible hardening of cement in contact with water and/or air. The most relevant environmental impacts associated with cement manufacturing are: atmospheric pollution from grinding and combustion processes, global warming, noise emissions and the depletion of natural resources associated with fossil fuels and energy. Its grinding, together with other additions and a setting regulator such as gypsum in appropriate proportions, results in cement with specific and standardized chemical, physical and mechanical properties depending on the type of addition (from limestone to fly ash or blast furnace slag, among others) and the fineness of grind. The final product is stored in silos for sale in bulk or later bagged. Dry mortar is a mixture of cement, sand and additives used in construction, either for bonding elements together or on a base, for coating, waterproofing and finishing works. The dry mortar plant produces a range of dry premixed masonry and specialty mortars, shipped in bulk or in bags, which replace on-site preparation.

Evolution of production activity
Business performance
Activity by type
Type of productive activity
| HOLDING | COMPANY | SITE | STATUS | wdt_ID | userid | YEAR | rp | SCOPE | CENTER | MAGNITUDE | UNIT | ACTIVITY | %RECYCLED | % Hazardous | SALES (€) | DESTINATION COUNTRY | REF. REPORT | REMARKS | link route | post_author | post_type |
|---|---|---|---|---|---|---|---|---|---|---|---|---|---|---|---|---|---|---|---|---|---|
| GCPV | CEMENTOS PORTLAND VALDERRIVAS, SA | THE HIGH | VALIDATED | 233 | 2.092 | 2023 | PRODUCTION | Factory | 141.464,00 | t | Production of WHITE CLINKER | Spain | EMAS | 2.092 | emas_statement | ||||||
| GCPV | CEMENTOS PORTLAND VALDERRIVAS, SA | THE HIGH | VALIDATED | 234 | 2.092 | 2024 | PRODUCTION | Factory | 199.677,00 | t | Production of WHITE CLINKER | Spain | EMAS | 2.092 | emas_statement | ||||||
| GCPV | CEMENTOS PORTLAND VALDERRIVAS, SA | THE HIGH | VALIDATED | 236 | 2.092 | 2023 | PRODUCTION | Factory | 665.751,00 | t | Production of GREY CEMENT | Spain | EMAS | 2.092 | emas_statement | ||||||
| GCPV | CEMENTOS PORTLAND VALDERRIVAS, SA | THE HIGH | VALIDATED | 237 | 2.092 | 2024 | PRODUCTION | Factory | 565.264,00 | t | Production of GREY CEMENT | Spain | EMAS | 2.092 | emas_statement | ||||||
| GCPV | CEMENTOS PORTLAND VALDERRIVAS, SA | THE HIGH | VALIDATED | 239 | 2.092 | 2023 | PRODUCTION | Factory | 608.011,00 | t | Production of GREY CLINKER | Spain | EMAS | 2.092 | emas_statement | ||||||
| GCPV | CEMENTOS PORTLAND VALDERRIVAS, SA | THE HIGH | VALIDATED | 240 | 2.092 | 2024 | PRODUCTION | Factory | 472.383,00 | t | Production of GREY CLINKER | Spain | EMAS | 2.092 | emas_statement | ||||||
| GCPV | CEMENTOS PORTLAND VALDERRIVAS, SA | THE HIGH | VALIDATED | 242 | 2.092 | 2023 | PRODUCTION | Factory | 111.199,00 | t | Production of WHITE cement | Spain | EMAS | 2.092 | emas_statement | ||||||
| GCPV | CEMENTOS PORTLAND VALDERRIVAS, SA | THE HIGH | VALIDATED | 243 | 2.092 | 2024 | PRODUCTION | Factory | 105.521,00 | t | Production of WHITE cement | Spain | EMAS | 2.092 | emas_statement | ||||||
| GCPV | CEMENTOS PORTLAND VALDERRIVAS, SA | THE HIGH | VALIDATED | 245 | 2.092 | 2023 | PRODUCTION | Factory | 14.789,00 | t | Production of DRY BULK MORTAR | Spain | EMAS | 2.092 | emas_statement | ||||||
| GCPV | CEMENTOS PORTLAND VALDERRIVAS, SA | THE HIGH | VALIDATED | 246 | 2.092 | 2024 | PRODUCTION | Factory | 12.784,00 | t | Production of DRY BULK MORTAR | Spain | EMAS | 2.092 | emas_statement | ||||||
| GCPV | CEMENTOS PORTLAND VALDERRIVAS, SA | THE HIGH | VALIDATED | 248 | 2.092 | 2023 | PRODUCTION | Factory | 29.121,00 | t | Production of DRY SACKED MORTAR | Spain | EMAS | 2.092 | emas_statement | ||||||
| GCPV | CEMENTOS PORTLAND VALDERRIVAS, SA | THE HIGH | VALIDATED | 249 | 2.092 | 2024 | PRODUCTION | Factory | 32.596,00 | t | Production of DRY SACKED MORTAR | Spain | EMAS | 2.092 | emas_statement | ||||||
| GCPV | CEMENTOS PORTLAND VALDERRIVAS, SA | THE HIGH | VALIDATED | 251 | 2.092 | 2023 | PRODUCTION | Quarry | 94.848,00 | t | Extraction and production of CLAY | Spain | EMAS | 2.092 | emas_statement | ||||||
| GCPV | CEMENTOS PORTLAND VALDERRIVAS, SA | THE HIGH | VALIDATED | 252 | 2.092 | 2024 | PRODUCTION | Quarry | 68.975,00 | t | Extraction and production of CLAY | Spain | EMAS | 2.092 | emas_statement | ||||||
| GCPV | CEMENTOS PORTLAND VALDERRIVAS, SA | THE HIGH | VALIDATED | 254 | 2.092 | 2023 | PRODUCTION | Quarry | 1.023.247,00 | t | Extraction and production of LIMESTONE | Spain | EMAS | 2.092 | emas_statement | ||||||
| GCPV | CEMENTOS PORTLAND VALDERRIVAS, SA | THE HIGH | VALIDATED | 255 | 2.092 | 2024 | PRODUCTION | Quarry | 752.115,00 | t | Extraction and production of LIMESTONE | Spain | EMAS | 2.092 | emas_statement | ||||||
Evolution of production activity
The wide range of products manufactured allows for the ideal selection based on the application. The cements marketed in 2025 from the El Alto plant include six grades of gray cement and two grades of white cement, all of which are certified with AENOR’s “N” Product Certification mark and bear the CE marking, complying with current legislation and the requirements of the UNE-EN 197-1 and UNE 80305 standards.
GRAY CEMENTS MARKETED
|
PRODUCT |
NORMA |
MARKET |
% PRODUCTION |
|
EMF I 52.5 R |
UNE-EN 197-1 |
Interior |
24,37 |
|
CEM I 52.5 N-SR 5 |
UNE EN 197-1 |
Interior |
9,24 |
|
CEM II/A-L 42.5 R |
UNE-EN 197-1 |
Interior |
2,40 |
|
CEM II/B-M (P-L) 32.5 N |
UNE-EN 197-1 |
Interior |
16,56 |
|
CEM II/A-M (P-L) 42.5 R (ac) |
UNE-EN 197-1 |
Interior |
29,54 |
|
CEM II/A-M (P-L) 42.5 R |
UNE-EN 197-1 |
Interior |
17,89 |
WHITE CEMENTS MARKETED
|
PRODUCT |
NORMA |
MARKET |
% PRODUCTION |
|
BL I 52,5 R |
UNE 80305 |
Inland/Export |
70,4 |
|
BL II/B-L 42.5 N |
UNE 80305 |
Interior |
29,6 |
As for dry mortar, our plant produces a wide range of masonry and special mortars, with more than 80 types of mortar capable of being marketed.

 |
Energy use and management |
Energy management
The processes involved in cement manufacturing—which include the calcination and grinding of raw materials, fuels, and clinker—require significant amounts of energy. This energy comes primarily from fuels (thermal energy) and electricity. For this reason, some of the improvement initiatives undertaken are aimed at optimizing energy consumption through the Recovery alternative fuels or by reducing electricity consumption. In 2023, the energy management system was certified according to the UNE-EN ISO 50001 standard, with the documentation component integrated into the existing Environmental Management System.

Environmental management and control
Fuel consumption
The fuels typically used in cement plants in Spain are petroleum derivatives, specifically petroleum coke and fuel oil. The dry mortar plant uses diesel to dry the sand. In quarry operations, the fuel used is diesel for mobile machinery. Since 2013, the El Alto plant has been authorized to Recovery from various Hazardous wastes, such as CDR, shredded tires, and meat meal, among others.
In 2025, a total of 38,173metric tons of alternative fuels were utilized in the production of gray clinker; specifically, RDF, shredded tires, plant and wood biomass, and olive pomace.
Recovery this year accounted for 44.5% ofthe total thermal energy required for the production of gray clinker. This figure represents an increase of 4 percentage points compared to the previous year, marking a significant improvement in this indicator.
Electricity consumption
Electricity is used in the process primarily for crushing materials extracted from quarries and grinding the raw material for petroleum coke, as well as for the final cement manufacturing process, with the latter accounting for the highest percentage of electricity consumption. In mortar manufacturing, the greatest electricity consumption is due to the mixing and bagging processes. Measures have been implemented to reduce electricity consumption and improve its management, such as replacing pumps with more efficient models, installing variable-frequency drives on motors, and switching to LED lighting. In addition, an investment has been initiated to upgrade the compressed air generation and distribution systems, which is expected to be completed by 2026.
Total electricity consumption was approximately 2,563 MWh higher than the previous year, due to increased production of gray clinker, which offset the decline in white clinker and cement production. There was a decrease in the MWh/t ratio for white cement thanks to improved management and a reduction in the proportion of excess white clinker production destined for export. The ratio for the gray clinker line has improved compared to the previous year, as more clinker was produced than was needed for the plant’s own cement production due to the distribution of clinker to other plants within the group. The limestone ratio has increased, and the possible causes are being investigated to propose improvements in plant operations. In the case of mortar, a worse ratio was observed, returning to the typical average values for this facility.
Evolution of specific metrics and ratios
Units of energy consumption in MWh and their ratios associated with the activity.
Energy consumption by fuel
Uses of energy
The energy magnitudes are always parameterized in MWh, showing in each cell its transformation to GJ, by means of the standard MWh*3.6 conversion (factor officially recognized and used by the SI (BIPM), Eurostat, IEA, IPCC and in Spain by MITECO).
| wdt_ID | userid | Year | Center | Units Pr. | Unit | Uses / Info | Electricity Consumption (MWh) | LNG/LPG consumption (MWh) | Oil / Coal (MWh) | Other Consumption (MWh) | gasnatural_gl | tankers_gl | other_gl | ind_gasnatural_gl | ind_petroliferos_gl | ind_other_gl | post_type | post_author | Electricity Ratio (Units Pr. | GN RatioPr.Units Pr. | Gasoline Ratio (Units Pr. | Ratio of other MWh toUnits Pr. | Total consumption ratio (Units Pr. | Total consumption (MWh) | Ratio of Total GJ/ Udp | Total GJ | Electrical in GJ | Electric GJ/udp Ratio |
|---|---|---|---|---|---|---|---|---|---|---|---|---|---|---|---|---|---|---|---|---|---|---|---|---|---|---|---|---|
| 169 | 2.092 | 2023 | Factory | 608.011,000 | t Gray clinker manufactured | Fossil fuel gray cement production | 0,000 | 0,000 | 394.375,000 | 0,000 | 0,000 | 1.419.750,000 | 0,000 | 0,000 | 2,335 | 0,000 | emas_statement | 2.092 | 0,000 | 0,000 | 0,649 | 0,000 | 0,649 | 394.375,000 | 2,335 | 1.419.750,000 | 0,000 | 0,000 |
| 170 | 2.092 | 2023 | Factory | 608.011,000 | t Gray clinker manufactured | Alternative fuel for gray cement production | 0,000 | 0,000 | 0,000 | 258.014,722 | 0,000 | 0,000 | 928.852,999 | 0,000 | 0,000 | 1,528 | emas_statement | 2.092 | 0,000 | 0,000 | 0,000 | 0,424 | 0,424 | 258.014,722 | 1,528 | 928.852,999 | 0,000 | 0,000 |
| 171 | 2.092 | 2023 | Factory | 141.464,000 | White clinker manufactured | Fossil fuel white cement production | 0,000 | 0,000 | 266.192,500 | 0,000 | 0,000 | 958.293,000 | 0,000 | 0,000 | 6,774 | 0,000 | emas_statement | 2.092 | 0,000 | 0,000 | 1,882 | 0,000 | 1,882 | 266.192,500 | 6,774 | 958.293,000 | 0,000 | 0,000 |
| 173 | 2.092 | 2023 | Factory | 34.299,000 | t Sand for mortar | Fossil fuel mortar production | 0,000 | 0,000 | 1.709,166 | 0,000 | 0,000 | 6.152,998 | 0,000 | 0,000 | 0,179 | 0,000 | emas_statement | 2.092 | 0,000 | 0,000 | 0,050 | 0,000 | 0,050 | 1.709,166 | 0,179 | 6.152,998 | 0,000 | 0,000 |
| 174 | 2.092 | 2024 | Factory | 36.236,000 | t Sand for mortar | Fossil fuel mortar production | 0,000 | 0,000 | 2.034,166 | 0,000 | 0,000 | 7.322,998 | 0,000 | 0,000 | 0,202 | 0,000 | emas_statement | 2.092 | 0,000 | 0,000 | 0,056 | 0,000 | 0,056 | 2.034,166 | 0,202 | 7.322,998 | 0,000 | 0,000 |
| 175 | 2.092 | 2023 | Quarry | 1.118.095,000 | Limestone + clay | Fossil fuel production | 0,000 | 0,000 | 4.908,611 | 0,000 | 0,000 | 17.671,000 | 0,000 | 0,000 | 0,016 | 0,000 | emas_statement | 2.092 | 0,000 | 0,000 | 0,004 | 0,000 | 0,004 | 4.908,611 | 0,016 | 17.671,000 | 0,000 | 0,000 |
| 176 | 2.092 | 2023 | Factory | 665.750,700 | t Gray Cement | Electricity production gray cement | 84.342,000 | 0,000 | 0,000 | 0,000 | 0,000 | 0,000 | 0,000 | 0,000 | 0,000 | 0,000 | emas_statement | 2.092 | 0,127 | 0,000 | 0,000 | 0,000 | 0,127 | 84.342,000 | 0,456 | 303.631,200 | 303.631,200 | 0,456 |
| 177 | 2.092 | 2023 | Factory | 111.199,000 | t White Cement | Electricity production white cement | 33.620,000 | 0,000 | 0,000 | 0,000 | 0,000 | 0,000 | 0,000 | 0,000 | 0,000 | 0,000 | emas_statement | 2.092 | 0,302 | 0,000 | 0,000 | 0,000 | 0,302 | 33.620,000 | 1,088 | 121.032,000 | 121.032,000 | 1,088 |
| 178 | 2.092 | 2023 | Quarry | 1.023.247,000 | t Limestone | Electricity production | 3.126,000 | 0,000 | 0,000 | 0,000 | 0,000 | 0,000 | 0,000 | 0,000 | 0,000 | 0,000 | emas_statement | 2.092 | 0,003 | 0,000 | 0,000 | 0,000 | 0,003 | 3.126,000 | 0,011 | 11.253,600 | 11.253,600 | 0,011 |
| 179 | 2.092 | 2023 | Factory | 43.910,450 | t Manufactured mortar | Electricity mortar production | 721,000 | 0,000 | 0,000 | 0,000 | 0,000 | 0,000 | 0,000 | 0,000 | 0,000 | 0,000 | emas_statement | 2.092 | 0,016 | 0,000 | 0,000 | 0,000 | 0,016 | 721,000 | 0,059 | 2.595,600 | 2.595,600 | 0,059 |
| 241 | 2.092 | 2024 | Factory | 472.383,000 | t Gray clinker manufactured | Fossil fuel gray cement production | 0,000 | 0,000 | 296.074,444 | 0,000 | 0,000 | 1.065.867,998 | 0,000 | 0,000 | 2,256 | 0,000 | emas_statement | 2.092 | 0,000 | 0,000 | 0,627 | 0,000 | 0,627 | 296.074,444 | 2,256 | 1.065.867,998 | 0,000 | 0,000 |
| 242 | 2.092 | 2024 | Factory | 472.383,000 | t Gray clinker manufactured | Alternative fuel for gray cement production | 0,000 | 0,000 | 0,000 | 201.827,500 | 0,000 | 0,000 | 726.579,000 | 0,000 | 0,000 | 1,538 | emas_statement | 2.092 | 0,000 | 0,000 | 0,000 | 0,427 | 0,427 | 201.827,500 | 1,538 | 726.579,000 | 0,000 | 0,000 |
| 243 | 2.092 | 2024 | Factory | 199.677,000 | White clinker manufactured | Fossil fuel white cement production | 0,000 | 0,000 | 372.356,111 | 0,000 | 0,000 | 1.340.482,000 | 0,000 | 0,000 | 6,713 | 0,000 | emas_statement | 2.092 | 0,000 | 0,000 | 1,865 | 0,000 | 1,865 | 372.356,111 | 6,713 | 1.340.482,000 | 0,000 | 0,000 |
| 244 | 2.092 | 2024 | Quarry | 821.090,000 | Limestone + clay | Fossil fuel production | 0,000 | 0,000 | 5.695,833 | 0,000 | 0,000 | 20.504,999 | 0,000 | 0,000 | 0,025 | 0,000 | emas_statement | 2.092 | 0,000 | 0,000 | 0,007 | 0,000 | 0,007 | 5.695,833 | 0,025 | 20.504,999 | 0,000 | 0,000 |
| 245 | 2.092 | 2024 | Factory | 565.263,870 | t Gray Cement | Electricity production gray cement | 70.299,000 | 0,000 | 0,000 | 0,000 | 0,000 | 0,000 | 0,000 | 0,000 | 0,000 | 0,000 | emas_statement | 2.092 | 0,124 | 0,000 | 0,000 | 0,000 | 0,124 | 70.299,000 | 0,448 | 253.076,400 | 253.076,400 | 0,448 |
| 246 | 2.092 | 2024 | Factory | 105.521,120 | t White Cement | Electricity production white cement | 42.766,000 | 0,000 | 0,000 | 0,000 | 0,000 | 0,000 | 0,000 | 0,000 | 0,000 | 0,000 | emas_statement | 2.092 | 0,405 | 0,000 | 0,000 | 0,000 | 0,405 | 42.766,000 | 1,459 | 153.957,600 | 153.957,600 | 1,459 |
| 247 | 2.092 | 2024 | Quarry | 752.115,000 | t Limestone | Electricity production | 2.280,000 | 0,000 | 0,000 | 0,000 | 0,000 | 0,000 | 0,000 | 0,000 | 0,000 | 0,000 | emas_statement | 2.092 | 0,003 | 0,000 | 0,000 | 0,000 | 0,003 | 2.280,000 | 0,011 | 8.208,000 | 8.208,000 | 0,011 |
| 248 | 2.092 | 2024 | Factory | 45.380,400 | t Manufactured mortar | Electricity mortar production | 534,000 | 0,000 | 0,000 | 0,000 | 0,000 | 0,000 | 0,000 | 0,000 | 0,000 | 0,000 | emas_statement | 2.092 | 0,012 | 0,000 | 0,000 | 0,000 | 0,012 | 534,000 | 0,042 | 1.922,400 | 1.922,400 | 0,042 |
| Year | Center | |||||||||||||||||||||||||||
| ∑ = 7,824,036.540 |
|
Renewable energies |
Energías Renovables
Configuración Colores
| wdt_ID | userid | Year | Center | Units Pr. | Units | Uses | Renewable consumed from third parties (MWh) | Renewable consumed self-generated (MWh) | Renewable generated (MWh) | post_author | Total renewable energy consumed (MWh) | Ratio of MWh of renewable energy consumed toUnits Pr. | Ratio of MWh of renewable energy generated perUnits of Pr. |
|---|---|---|---|---|---|---|---|---|---|---|---|---|---|
| 79 | 2.092 | 2023 | Factory + Quarry | 820.860,000 | t Product manufactured | Production | 210.901,944 | 0,000 | 0,000 | 2.092 | 210.901,944 | 0,2569 | 0,0000 |
| 102 | 2.092 | 2024 | Factory + Quarry | 808.899,000 | t Product manufactured | Production | 179.805,000 | 0,000 | 0,000 | 2.092 | 179.805,000 | 0,2223 | 0,0000 |
| wdt_ID | userid | Year | Center | Units | post_author | ||||||||
| ∑ = 1,629,759.000 |
Note: Renewable electricity through PPAs and a certificate from an electricity retailer with 3.4% renewable energy.
 |
Water use and management |
Water management
The water consumed for domestic use and in the process of cooling equipment, conditioning process gases and reducing diffuse emissions in the quarry area comes from wells and rainwater collection at the plant. The water circuit in the plant is closed: there is a water treatment plant for the plant and therefore no water is discharged.

Environmental management and control
Specific water consumption has remained virtually the same as the previous year. Work has continued on replacing sections of piping in order to modernize the water system and prevent leaks.
Evolution of specific metrics and ratios
Water consumption (m³) and ratios
Water Uses
| state | wdt_ID | userid | Year | Center | Units Pr. | Unit | Origin of water | Uses | m3 | ID | post_author | Ratio (Units Pr. |
|---|---|---|---|---|---|---|---|---|---|---|---|---|
| VALIDATED | 170 | 2.092 | 2023 | Factory | 820.860,000 | t Product Manufactured | Wells, Pluvial | Various uses | 166.734,000 | 138.973 | 2.092 | 0,203121 |
| VALIDATED | 191 | 2.092 | 2024 | Factory | 808.899,000 | t Product manufactured | Wells, Pluvial | Various uses | 164.113,000 | 138.973 | 2.092 | 0,202884 |
| VALIDATED | 210 | 2.092 | 2023 | Quarry | 820.860,000 | t Product manufactured | Wells, Pluvial | Various uses | 393,000 | 138.973 | 2.092 | 0,000479 |
| VALIDATED | 211 | 2.092 | 2024 | Quarry | 808.899,000 | t Product manufactured | Wells, Pluvial | Various uses | 1.563,000 | 138.973 | 2.092 | 0,001932 |
| state | wdt_ID | userid | Year | Center | Unit | Origin of water | Uses | ID | post_author |
Note:
 |
Waste water discharge management |
Wastewater management
The water circuit of the facility is closed, so that 100% of the water supplied is reused and does not evaporate. This water is supplied by groundwater from wells and a rainwater and sanitary water collection pond located in the factory. Therefore, no water is discharged into the public water domain or the municipal network.
Environmental management and control
 |
Atmospheric emissions |
Emissions management
Particles and combustion gases are the most characteristic atmospheric emissions from our operations. Emissions generated during the handling, transport, storage, and processing of powdered materials are released through both ducted and diffuse sources, while combustion gases are emitted through furnace stacks; the most common compounds emitted areCO₂,NOx ,and SO₂, along with other minor pollutants. The emission of pollutants is controlled by Authorized Control Bodies and continuous systems installed in the factory chimneys, following the requirements of an Environmental Monitoring Plan that complies with the Integrated Environmental Authorization.

Environmental management and control
In the cement, mortar and quarrying processes, there are several sources of stack emissions. The main sources are the clinker kilns, the cooler of the white clinker line, cement grinding, petroleum coke grinding, the sand dryer of the mortar plant and crushing of material in the quarry. All of them have purification systems based on bag filters or electrostatic filters, which are some of the Best Available Techniques (BAT) in the sector, and continuous measurement systems for pollutants, except for the quarry, bagging and mortar plants, for which periodic regulatory measurements are carried out. The main combustion sources, the three clinker kilns, have ammonia water injection systems to reduce NOx emissions, a system considered as BAT. In 2025, there were no instances of atmospheric emission limits being exceeded. Emission levels remained largely unchanged from previous years at the main sources—the gray and white kilns, the cement and fuel mills, and the white line cooler. Flue gas emission levels comply with the legal limits established in the Integrated Environmental Permit. In 2025, there was a one-time exceedance of the daily average NOx value, which was reported to the authorities; following an analysis of the causes, this led to the repair of the injection and dispersion nozzles for the ammonia water solution, which reduce NOx emissions. The plant’s overall greenhouse gas emissions have decreased, thanks to an improvement in the gray clinker ratio that has offset the increase in white clinker production—a material for which the emissions ratio has also been reduced. In 2025, 620,313 metric tons ofCO₂ were emitted into the atmosphere, originating primarily from the decarbonation of limestone—through the transformation of limestone into calcium oxide at the high temperatures of the process —and from the combustion process—through the oxidation of carbon in fuels in the presence of oxygen—which amounted to 751 kgCO₂/t of gray clinker and 1,125 kgCO₂/t of white clinker. Of the total emissions, those from small combustion units integrated into the factory—such as boilers, generator sets, and shrink-wrapping machines—accounted for 234.4 metric tons ofCO2. In addition toCO2, there are other greenhouse gases that, although they account for only a small portion of our process, we have decided to take into account. In 2025, emissions of other greenhouse gases were not quantified. On the other hand, thanks to the use of alternative biomass fuels in place of conventional fossil fuels, 56,268 metric tons of fossil-basedCO2 emissions were avoided. Particulate emissions resulting from the transfer and handling of powdered materials have been minimized through the implementation of a series of preventive measures, such as paving traffic areas, enclosing conveyor belts, installing extraction systems at transfer, loading, and unloading points, erecting windbreaks, and watering tracks and roads, among others. To monitor air quality around the factory and quarry, two air quality monitoring stations continuously measure particulate matter (PM-10),SO₂,O₃,NOx, andNO₂. In addition, summer campaigns are conducted to measure settleable particulate matter in the quarry area. In 2025, none of the measured points showed values above the established emission limits. Beyond the impact on air quality, we also take into account greenhouse gas emissions—carbon dioxide, methane, and nitrous oxide—resulting from the use of mobile machinery. In 2025, this resulted in a total of 2,039 metric tons ofCO2 equivalent from diesel consumption in mobile machinery (CH4,N2O, andCO2). The calculation was based on the factors published by the Ministry of Ecological Transition and Demographic Challenge. The Company's continuous concern for reducing emission levels has resulted in maintaining them below the legal limits and improving our most relevant environmental impact, even in the case of minority pollutants. Data corresponding to 29 pollutants are reported annually to the State Pollutant Emissions and Sources Register, PRTR Spain, in the form of pollutant load of channeled emissions. This inventory reports the annual mass load emitted, on which threshold values for notification are established, values that are not in any case indicators of environmental performance. Emissions from channeled sources
Particulate matter emission
Emission of combustion gases
Continuously measured emissions of SO₂, NOx, CO, NH₃, HCl, and TOC remain at levels similar to those of previous years.Confined greenhouse gas emissions
Diffuse source emissions
Other emissions
| state | wdt_ID | userid | Year | Centre/Focus | Units Pr. | Unit | Origin/Type | Pollutant | Concentration | Conc. unit | Limit | Mass emission (kg) | ID | post_author | Ratio (kgUnits Pr. |
|---|---|---|---|---|---|---|---|---|---|---|---|---|---|---|---|
| VALIDATED | 316 | 2.092 | 2023 | Factory | 820.860,000 | t Product manufactured | Vehicle emission source | Total particles | kg/year | 16.737,000 | 138.973 | 2.092 | 0,020 | ||
| VALIDATED | 318 | 2.092 | 2023 | Quarry | 1.118.095,000 | t Limestone + clay production | Diffuse emissions | Total particles | kg/year | 37,800 | 138.973 | 2.092 | 0,000 | ||
| VALIDATED | 321 | 2.092 | 2023 | Factory | 820.860,000 | t Product manufactured | Vehicle emission source | NOx | kg/year | 642.447,000 | 138.973 | 2.092 | 0,783 | ||
| VALIDATED | 322 | 2.092 | 2023 | Factory | 820.860,000 | t Product manufactured | Vehicle emission source | SO2 | kg/year | 23.020,000 | 138.973 | 2.092 | 0,028 | ||
| VALIDATED | 326 | 2.092 | 2023 | Factory | 820.860,000 | t Product manufactured | Vehicle emission source | HCL | kg/year | 2.801,000 | 138.973 | 2.092 | 0,003 | ||
| VALIDATED | 327 | 2.092 | 2023 | Factory | 820.860,000 | t Product manufactured | Vehicle emission source | HF | kg/year | 8,000 | 138.973 | 2.092 | 0,000 | ||
| VALIDATED | 328 | 2.092 | 2023 | Factory | 820.860,000 | t Product manufactured | Vehicle emission source | Dioxins and Furans | mg/year | 7,520 | 138.973 | 2.092 | 0,000 | ||
| VALIDATED | 333 | 2.092 | 2023 | Quarry Point 1 (NORTH) | 1.118.095,000 | t Limestone + clay production | Diffuse emissions | SETTLEABLE PARTICLES | 82,200 | mg/m2/day | 300 | 138.973 | 2.092 | 0,000 | |
| VALIDATED | 334 | 2.092 | 2023 | Quarry Point 2 (SOUTH) | 1.118.095,000 | t Limestone + clay production | Diffuse emissions | SETTLEABLE PARTICLES | 23,100 | mg/m2/day | 300 | 138.973 | 2.092 | 0,000 | |
| VALIDATED | 335 | 2.092 | 2023 | Quarry Point 3 (EAST) | 1.118.095,000 | t Limestone + clay production | Diffuse emissions | SETTLEABLE PARTICLES | 26,400 | mg/m2/day | 300 | 138.973 | 2.092 | 0,000 | |
| VALIDATED | 336 | 2.092 | 2023 | Quarry Point 4 (SOUTH-WEST) | 1.118.095,000 | t Limestone + clay production | Diffuse emissions | SETTLEABLE PARTICLES | 65,100 | mg/m2/day | 300 | 138.973 | 2.092 | 0,000 | |
| VALIDATED | 506 | 2.092 | 2024 | Factory | 808.899,000 | t Product manufactured | Vehicle emission source | Total particles | kg/year | 16.992,000 | 138.973 | 2.092 | 0,021 | ||
| VALIDATED | 507 | 2.092 | 2024 | Quarry | 821.090,000 | t Limestone + clay production | Diffuse emissions | Total particles | kg/year | 0,000 | 138.973 | 2.092 | 0,000 | ||
| VALIDATED | 508 | 2.092 | 2024 | Factory | 808.899,000 | t Product manufactured | Vehicle emission source | NOx | kg/year | 775.543,000 | 138.973 | 2.092 | 0,959 | ||
| VALIDATED | 509 | 2.092 | 2024 | Factory | 808.899,000 | t Product manufactured | Vehicle emission source | SO2 | kg/year | 32.921,000 | 138.973 | 2.092 | 0,041 | ||
| VALIDATED | 510 | 2.092 | 2024 | Factory | 808.899,000 | t Product manufactured | Vehicle emission source | HCL | kg/year | 2.023,000 | 138.973 | 2.092 | 0,003 | ||
| VALIDATED | 511 | 2.092 | 2024 | Factory | 808.899,000 | t Product manufactured | Vehicle emission source | HF | kg/year | 47,000 | 138.973 | 2.092 | 0,000 | ||
| VALIDATED | 512 | 2.092 | 2024 | Factory | 808.899,000 | t Product manufactured | Vehicle emission source | Dioxins and Furans | mg/year | 6,940 | 138.973 | 2.092 | 0,000 | ||
| VALIDATED | 513 | 2.092 | 2024 | Quarry Point 1 (NORTH) | 821.090,000 | t Limestone + clay production | Diffuse emissions | SETTLEABLE PARTICLES | 203,300 | mg/m2/day | 300 | 138.973 | 2.092 | 0,000 | |
| VALIDATED | 514 | 2.092 | 2024 | Quarry Point 2 (SOUTH) | 821.090,000 | t Limestone + clay production | Diffuse emissions | SETTLEABLE PARTICLES | 273,600 | mg/m2/day | 300 | 138.973 | 2.092 | 0,000 | |
| VALIDATED | 515 | 2.092 | 2024 | Quarry Point 3 (EAST) | 821.090,000 | t Limestone + clay production | Diffuse emissions | SETTLEABLE PARTICLES | 175,000 | mg/m2/day | 300 | 138.973 | 2.092 | 0,000 | |
| VALIDATED | 516 | 2.092 | 2024 | Quarry Point 4 (SOUTH-WEST) | 821.090,000 | t Limestone + clay production | Diffuse emissions | SETTLEABLE PARTICLES | 87,400 | mg/m2/day | 300 | 138.973 | 2.092 | 0,000 | |
| VALIDATED | 808 | 2.092 | 2025 | Quarry Point 2 (SOUTH) | 1.010.008,000 | t Limestone + clay production | Diffuse emissions | SETTLEABLE PARTICLES | 113,100 | mg/m2/day | 300 | 138.973 | 2.092 | 0,000 | |
| VALIDATED | 809 | 2.092 | 2025 | Quarry Point 3 (EAST) | 1.010.008,000 | t Limestone + clay production | Diffuse emissions | SETTLEABLE PARTICLES | 61,400 | mg/m2/day | 300 | 138.973 | 2.092 | 0,000 | |
| VALIDATED | 810 | 2.092 | 2025 | Quarry Point 4 (SOUTH-WEST) | 1.010.008,000 | t Limestone + clay production | Diffuse emissions | SETTLEABLE PARTICLES | 133,700 | mg/m2/day | 300 | 138.973 | 2.092 | 0,000 | |
| VALIDATED | 835 | 2.092 | 2024 | Factory | 808.899,000 | Vehicle emission source | SO2 GRAY | 7,000 | mg/Nm3 | 50 | 138.973 | 2.092 | 0,000 | ||
| VALIDATED | 836 | 2.092 | 2024 | Factory | 808.899,000 | Vehicle emission source | WHITE SO2 | 26,600 | mg/Nm3 | 400 | 138.973 | 2.092 | 0,000 | ||
| VALIDATED | 837 | 2.092 | 2024 | Factory | 808.899,000 | Vehicle emission source | Gray particles | 5,200 | mg/Nm3 | 20 | 138.973 | 2.092 | 0,000 | ||
| VALIDATED | 838 | 2.092 | 2024 | Factory | 808.899,000 | Vehicle emission source | BLANCO Particles | 1,000 | mg/Nm3 | 20 | 138.973 | 2.092 | 0,000 | ||
| VALIDATED | 839 | 2.092 | 2024 | Factory | 808.899,000 | Vehicle emission source | NOx (White) | 371,900 | mg/Nm3 | 800 | 138.973 | 2.092 | 0,000 | ||
| VALIDATED | 840 | 2.092 | 2024 | Factory | 808.899,000 | Vehicle emission source | NOx (Gray) | 353,200 | mg/Nm3 | 450 | 138.973 | 2.092 | 0,000 | ||
| VALIDATED | 841 | 2.092 | 2024 | Factory | 808.899,000 | Vehicle emission source | NH3 WHITE | 1,300 | mg/Nm3 | 50 | 138.973 | 2.092 | 0,000 | ||
| VALIDATED | 842 | 2.092 | 2024 | Factory | 808.899,000 | Vehicle emission source | NH3 GRAY | 12,800 | mg/Nm3 | 50 | 138.973 | 2.092 | 0,000 | ||
| VALIDATED | 843 | 2.092 | 2024 | Factory | 808.899,000 | Vehicle emission source | WHITE CO | 374,200 | mg/Nm3 | 1000 | 138.973 | 2.092 | 0,000 | ||
| VALIDATED | 844 | 2.092 | 2024 | Factory | 808.899,000 | Vehicle emission source | CO Gray | 725,900 | mg/Nm3 | 2000 | 138.973 | 2.092 | 0,000 | ||
| VALIDATED | 845 | 2.092 | 2024 | Factory | 808.899,000 | Vehicle emission source | WHITE HCl | 0,570 | mg/Nm3 | - | 138.973 | 2.092 | 0,000 | ||
| VALIDATED | 846 | 2.092 | 2024 | Factory | 808.899,000 | Vehicle emission source | HCl GRAY | 5,600 | mg/Nm3 | - | 138.973 | 2.092 | 0,000 | ||
| VALIDATED | 847 | 2.092 | 2024 | Factory | 808.899,000 | Vehicle emission source | WHITE COT | 0,000 | mg/Nm3 | - | 138.973 | 2.092 | 0,000 | ||
| VALIDATED | 848 | 2.092 | 2024 | Factory | 808.899,000 | Vehicle emission source | GRAY COT | 5,000 | mg/Nm3 | - | 138.973 | 2.092 | 0,000 | ||
| VALIDATED | 849 | 2.092 | 2024 | Factory | 808.899,000 | Vehicle emission source | HF WHITE | 0,000 | mg/Nm3 | - | 138.973 | 2.092 | 0,000 | ||
| VALIDATED | 850 | 2.092 | 2024 | Factory | 808.899,000 | Vehicle emission source | HF Gray | 0,033 | mg/Nm3 | 1 | 138.973 | 2.092 | 0,000 | ||
| VALIDATED | 851 | 2.092 | 2024 | Factory | 808.899,000 | Vehicle emission source | Dioxins and furans BLANCO | 0,004 | ng ITEQ/Nm³ | - | 138.973 | 2.092 | 0,000 | ||
| VALIDATED | 852 | 2.092 | 2024 | Factory | 808.899,000 | Vehicle emission source | Dioxins and furans GRIS | 0,004 | ng ITEQ/Nm³ | - | 138.973 | 2.092 | 0,000 | ||
| VALIDATED | 853 | 2.092 | 2023 | Factory | 820.860,000 | Vehicle emission source | NOx GRIS Furnace 7 | 356,000 | mg/Nm3 | 450 | 138.973 | 2.092 | 0,000 | ||
| VALIDATED | 854 | 2.092 | 2023 | Factory | 820.860,000 | Vehicle emission source | NOx (White) | 308,000 | mg/Nm3 | 800 | 138.973 | 2.092 | 0,000 | ||
| VALIDATED | 855 | 2.092 | 2023 | Factory | 820.860,000 | Vehicle emission source | WHITE SO2 | 33,000 | mg/Nm3 | 400 | 138.973 | 2.092 | 0,000 | ||
| VALIDATED | 856 | 2.092 | 2023 | Factory | 820.860,000 | Vehicle emission source | SO2 Gray Oven 7 | 1,600 | mg/Nm3 | 50 | 138.973 | 2.092 | 0,000 | ||
| VALIDATED | 857 | 2.092 | 2023 | Factory | 820.860,000 | Vehicle emission source | BLANCO Particles | 0,100 | mg/Nm3 | 20 | 138.973 | 2.092 | 0,000 | ||
| VALIDATED | 858 | 2.092 | 2023 | Factory | 820.860,000 | Vehicle emission source | GRIS Particles Oven 7 | 7,900 | mg/Nm3 | 20 | 138.973 | 2.092 | 0,000 | ||
| VALIDATED | 859 | 2.092 | 2023 | Factory | 820.860,000 | Vehicle emission source | WHITE CO | 309,000 | mg/Nm3 | 1000 | 138.973 | 2.092 | 0,000 | ||
| VALIDATED | 860 | 2.092 | 2023 | Factory | 820.860,000 | Vehicle emission source | CO GRIS Oven 7 | 665,000 | mg/Nm3 | 2000 | 138.973 | 2.092 | 0,000 | ||
| VALIDATED | 861 | 2.092 | 2023 | Factory | 820.860,000 | t Product manufactured | Vehicle emission source | CO | kg/year | 1.027.327,000 | 138.973 | 2.092 | 1,252 | ||
| VALIDATED | 862 | 2.092 | 2023 | Factory | 820.860,000 | t Product manufactured | Vehicle emission source | COT | kg/year | 9.112,000 | 138.973 | 2.092 | 0,011 | ||
| VALIDATED | 863 | 2.092 | 2023 | Factory | 820.860,000 | t Product manufactured | Vehicle emission source | NH3 | kg/year | 5.248,000 | 138.973 | 2.092 | 0,006 | ||
| VALIDATED | 864 | 2.092 | 2023 | Factory | 820.860,000 | Vehicle emission source | NH3 WHITE | 2,200 | mg/Nm3 | 50 | 138.973 | 2.092 | 0,000 | ||
| VALIDATED | 865 | 2.092 | 2023 | Factory | 820.860,000 | Vehicle emission source | NH3 GRAY | 3,200 | mg/Nm3 | 50 | 138.973 | 2.092 | 0,000 | ||
| VALIDATED | 866 | 2.092 | 2023 | Factory | 820.860,000 | Vehicle emission source | WHITE COT | 0,000 | mg/Nm3 | - | 138.973 | 2.092 | 0,000 | ||
| VALIDATED | 867 | 2.092 | 2023 | Factory | 820.860,000 | Vehicle emission source | COT GRIS Oven 7 | 7,300 | mg/Nm3 | - | 138.973 | 2.092 | 0,000 | ||
| VALIDATED | 868 | 2.092 | 2023 | Factory | 820.860,000 | Vehicle emission source | WHITE HCl | 0,000 | mg/Nm3 | - | 138.973 | 2.092 | 0,000 | ||
| VALIDATED | 869 | 2.092 | 2023 | Factory | 820.860,000 | Vehicle emission source | HCl GRIS Oven 7 | 2,200 | mg/Nm3 | - | 138.973 | 2.092 | 0,000 | ||
| VALIDATED | 870 | 2.092 | 2023 | Factory | 820.860,000 | Vehicle emission source | HF WHITE | 0,000 | mg/Nm3 | - | 138.973 | 2.092 | 0,000 | ||
| VALIDATED | 871 | 2.092 | 2023 | Factory | 820.860,000 | Vehicle emission source | HF Gray | 0,100 | mg/Nm3 | - | 138.973 | 2.092 | 0,000 | ||
| VALIDATED | 872 | 2.092 | 2023 | Factory | 820.860,000 | Vehicle emission source | Dioxins and furans BLANCO | 0,005 | ng ITEQ/Nm³ | 0,1 | 138.973 | 2.092 | 0,000 | ||
| VALIDATED | 873 | 2.092 | 2023 | Factory | 820.860,000 | Vehicle emission source | Dioxins and furans GRIS Furnace 7 | 0,017 | ng ITEQ/Nm³ | 0,1 | 138.973 | 2.092 | 0,000 | ||
| VALIDATED | 874 | 2.092 | 2023 | Factory | 820.860,000 | Vehicle emission source | Hg GRIS Oven 7 | 0,022 | mg/Nm3 | 0,05 | 138.973 | 2.092 | 0,000 | ||
| VALIDATED | 875 | 2.092 | 2023 | Factory | 820.860,000 | t Product manufactured | Vehicle emission source | Hg | kg/year | 42,267 | 138.973 | 2.092 | 0,000 | ||
| VALIDATED | 876 | 2.092 | 2023 | Factory | 820.860,000 | Vehicle emission source | CD+TL GRAY Oven 7 | 0,008 | mg/Nm3 | 0,05 | 138.973 | 2.092 | 0,000 | ||
| VALIDATED | 877 | 2.092 | 2023 | Factory | 820.860,000 | Vehicle emission source | Sb+As+Pb+Cr+Co+Cu+Mn+Ni+V Gray Furnace 7 | 0,041 | mg/Nm3 | 0,5 | 138.973 | 2.092 | 0,000 | ||
| VALIDATED | 878 | 2.092 | 2024 | Factory | 808.899,000 | t Product manufactured | Vehicle emission source | Hg | kg/year | 11,159 | 138.973 | 2.092 | 0,000 | ||
| VALIDATED | 879 | 2.092 | 2024 | Factory | 808.899,000 | Vehicle emission source | Hg Gray | 0,006 | mg/Nm3 | 0,05 | 138.973 | 2.092 | 0,000 | ||
| VALIDATED | 880 | 2.092 | 2024 | Factory | 808.899,000 | Vehicle emission source | CD+TL GRAY Oven 7 | 0,016 | mg/Nm3 | 0,05 | 138.973 | 2.092 | 0,000 | ||
| VALIDATED | 881 | 2.092 | 2024 | Factory | 808.899,000 | Vehicle emission source | Sb+As+Pb+Cr+Co+Cu+Mn+Ni+V GRAY | 0,078 | mg/Nm3 | 0,05 | 138.973 | 2.092 | 0,000 | ||
| state | wdt_ID | userid | Year | Centre/Focus | Unit | Origin/Type | Pollutant | ID | post_author | ||||||
| ∑ = 60,821,781.000 |
* For source measurements where the emission is below the test’s detection limit, it is not possible to determine the pollutant load of that source, and it is estimated based on the number of samples and the detection limit. If all measurements are below the detection limit, the value will be zero “0.” The emission limit value for the Krupp and FLS crushers is 50 mg/Nm³ starting in 2024. No measurements are available for the FLS crusher because it was in operation for only a few hours in 2023 and was shut down in 2024 and 2025. The limit value for the mortar dryer is 10 mg/Nm³. Cement mill 7 has been shut down since 2015.
 |
CO2 emissions |
CO₂ emissions per center.
GHG calculated
| wdt_ID | userid | Year | Center | Units Pr. | Units | Origin/Type | CO2eq Direct (S1) | CO2eq Indirect (S2) | CO2eq Indirect (S3) | CO2eq Saved/Compensated | ID | post_author | Category GHG (S3) | T CO2eq Total | TotalUnits Pr. | IndirectUnits ratio | DirectUnits ratio | Ratio of CO2eq Savings toUnits Pr. |
|---|---|---|---|---|---|---|---|---|---|---|---|---|---|---|---|---|---|---|
| 224 | 2.092 | 2023 | Factory | 608.011,000 | t Gray Clinker | Gray clinker production | 470.542,000 | 138.973 | 2.092 | 470.542,000 | 0,773904 | 0,000000 | 0,773904 | 0,000000 | ||||
| 233 | 2.092 | 2023 | Factory | 141.464,000 | White Clinker | White clinker production | 162.589,000 | 138.973 | 2.092 | 162.589,000 | 1,149331 | 0,000000 | 1,149331 | 0,000000 | ||||
| 261 | 2.092 | 2024 | Factory | 472.383,000 | t Gray Clinker | Gray clinker production | 358.751,600 | 138.973 | 2.092 | 358.751,600 | 0,759451 | 0,000000 | 0,759451 | 0,000000 | ||||
| 262 | 2.092 | 2024 | Factory | 199.677,000 | White Clinker | White clinker production | 228.362,000 | 138.973 | 2.092 | 228.362,000 | 1,143657 | 0,000000 | 1,143657 | 0,000000 | ||||
| 301 | 2.092 | 2024 | Factory | 808.899,000 | t Product manufactured | CO2 emissions electric energy Non-renewable | 0,000 | 7.112,960 | 138.973 | 2.092 | 7.112,960 | 0,008793 | 0,008793 | 0,000000 | 0,000000 | |||
| 304 | 2.092 | 2024 | Factory | 808.899,000 | t Product manufactured | CO2 Renewable electricity consumption, energy supplier, and PPAs | 0,000 | 0,000 | -26.014,860 | 138.973 | 2.092 | 0,000 | 0,000000 | 0,000000 | 0,000000 | 0,032161 | ||
| 305 | 2.092 | 2024 | Factory | 808.899,000 | t Product manufactured | Replacement of fossil fuels | 0,000 | 0,000 | -40.451,000 | 138.973 | 2.092 | 0,000 | 0,000000 | 0,000000 | 0,000000 | 0,050007 | ||
| wdt_ID | userid | Year | Center | Units Pr. | Units | Origin/Type | ID | post_author | Category GHG (S3) |
Note: Scope 1 (S1) emissions include only those verified under the European Union's Greenhouse Gas Emissions Trading Directive and implementing regulations.
 |
Waste production and management |
GenerWaste generation
The cement and mortar manufacturing process does not give rise to the generation of waste, which is derived from facility maintenance activities, modification works, building cleaning, laboratory, medical service, among others. The management criteria established are based on minimization in the generation process, reuse and recycling, with internal segregation and appropriate external management for each type of waste.
Environmental management and control
During 2025, the generation of Hazardous waste Hazardous by 81% due to an oil change in the gear reducers of the cement mills, the one-time disposal of various transformers containing PCBs, and the cleanup of computer equipment and other items stored in the former offices, which resulted in a large volume of WEEE.
With regard to Hazardous waste generation, there was a significant increase of 42% compared to the previous year. The most significant factor contributing to this result was the increase in construction waste generation, due to the cleanup of materials accumulated in the storage areas, scrap metal, from the dismantling of certain structures and the removal of obsolete equipment, as well as paper, cardboard, and plastic resulting from the cleanup of archives in the former offices and used conveyor belts, due to the replacement of a section of the conveyor belt that transports limestone from the quarry.
Work continues on recovering non-conforming materials during the bagging process and on reusing materials at the quarry for further processing.
Hazardous Waste Reduction Plan
For the period 2025-2028, the result of the previous plan is taken into consideration, establishing new objectives for the waste from the previous plan, including sanitary waste. In order to achieve them, the following minimization measures are established:
- Creation of a work team to study the possibilities of reducing used oil and fats at source, such as the search for more resistant oils and fats, reuse of filtered oils in equipment with less demanding requirements...
- Contaminated packaging: Evaluate the return to the supplier for reuse, as well as supply formats for larger volumes, considering supplies made by companies that provide services at the plant.
- Health care waste: Control of medicine stocks
- Transversal 1.1. Operational control. Improve the organization at source and provide more environmental support to factory teams to achieve greater control of weak points in waste generation and better waste segregation.
- Transversal 1.2. Stock monitoring and segregation. Priority will be given to stock adequacy and segregation. Rectify their deposition if necessary.
Evolution of specific metrics and ratios
Generación de residuos
Destination of waste
Type and destination
| wdt_ID | userid | Year | Center | Units Pr. | Units | Non Hazardous | Hazardous | Disposal/ Controlled landfill | Other treatments | Recovery | By-products | post_author | NP Ratio (kg)Units Pr. | RP Ratio (kg)Units Pr. | Totals (t) | Total ratio (t)Units Pr. |
|---|---|---|---|---|---|---|---|---|---|---|---|---|---|---|---|---|
| 92 | 2.092 | 2023 | Factory and Quarry | 820.860,000 | t Product Manufactured | 2.068,960 | 37,070 | 36,562 | 2.069,467 | 2.092 | 2,520 | 0,04515995419 | 2.106,03 | 0,002565638477 | ||
| 110 | 2.092 | 2024 | Factory and Quarry | 808.899,000 | t Product Manufactured | 2.322,339 | 28,663 | 55,312 | 2.305,999 | 2.092 | 2,871 | 0,03543458454 | 2.351,00 | 0,002906422186 | ||
| wdt_ID | userid | Year | Center | Units | post_author | |||||||||||
| ∑ = 1,629,759.000 |
List of waste
| wdt_ID | userid | Year | Center | Units Pr. | Units | Description of the waste | CER/LER code. | Treatment | Hazardous | Quantity (t) | post_author | Ratio quantity (t)/pdU. |
|---|---|---|---|---|---|---|---|---|---|---|---|---|
| 1.442 | 2.092 | 2023 | Factory and Quarry | 915.490,000 | t Product manufactured | Paper and cardboard | 150101 / 200101 | R12 | No | 137,970 | 2.092 | 0,000150706179 |
| 1.443 | 2.092 | 2023 | Factory and Quarry | 915.490,000 | t Product manufactured | Plastic containers | 150102 | R12 | No | 16,120 | 2.092 | 0,000017608057 |
| 1.444 | 2.092 | 2023 | Factory and Quarry | 915.490,000 | t Product manufactured | RCDs | 170904 | R12-R5 | No | 1.015,060 | 2.092 | 0,001108761428 |
| 1.445 | 2.092 | 2023 | Factory and Quarry | 915.490,000 | t Product manufactured | Urban assimilable waste | 200307 | D5 | No | 12,960 | 2.092 | 0,000014156353 |
| 1.446 | 2.092 | 2023 | Factory and Quarry | 915.490,000 | t Product manufactured | Sleeves | 150203 | D5 | No | 0,000 | 2.092 | 0,000000000000 |
| 1.447 | 2.092 | 2023 | Factory and Quarry | 915.490,000 | t Product manufactured | Mixed metals | 191202 | R12 | No | 327,620 | 2.092 | 0,000357863002 |
| 1.448 | 2.092 | 2023 | Factory and Quarry | 915.490,000 | t Product manufactured | Wood | 170201 | R12 | No | 78,420 | 2.092 | 0,000085659046 |
| 1.449 | 2.092 | 2023 | Factory and Quarry | 915.490,000 | t Product manufactured | Septic tank sludge | 200304 | D8 | No | 18,000 | 2.092 | 0,000019661602 |
| 1.450 | 2.092 | 2023 | Factory and Quarry | 915.490,000 | t Product manufactured | Used tapes | 191202 | R12 | No | 62,220 | 2.092 | 0,000067963604 |
| 1.451 | 2.092 | 2023 | Factory and Quarry | 915.490,000 | t Product manufactured | Furnace refractory bricks | 161106 | R5 | No | 323,180 | 2.092 | 0,000353013141 |
| 1.452 | 2.092 | 2023 | Factory and Quarry | 915.490,000 | t Product manufactured | Waste electrical and electronic equipment (WEEE) | 160214 | R12 | No | 0,490 | 2.092 | 0,000000535232 |
| 1.453 | 2.092 | 2023 | Factory and Quarry | 915.490,000 | t Product manufactured | End-of-life tires | 160103 | R13 | No | 1,080 | 2.092 | 0,000001179696 |
| 1.454 | 2.092 | 2023 | Factory and Quarry | 915.490,000 | t Product manufactured | Biodegradable waste (pruning) | 200201 | R12 | No | 69,180 | 2.092 | 0,000075566090 |
| 1.455 | 2.092 | 2023 | Factory and Quarry | 915.490,000 | t Product manufactured | Copper | 170401 | R12 | No | 2,280 | 2.092 | 0,000002490470 |
| 1.456 | 2.092 | 2023 | Factory and Quarry | 915.490,000 | t Product manufactured | Bulky waste | 200307 | R12 | No | 4,380 | 2.092 | 0,000004784323 |
| 1.457 | 2.092 | 2023 | Factory and Quarry | 915.490,000 | t Product manufactured | Others | . | . | No | 0,000 | 2.092 | 0,000000000000 |
| 1.474 | 2.092 | 2023 | Factory and Quarry | 915.490,000 | t Product manufactured | Used oil | 130205 | R12 | Yes | 26,200 | 2.092 | 0,000028618554 |
| 1.475 | 2.092 | 2023 | Factory and Quarry | 915.490,000 | t Product manufactured | Contaminated rags | 150202 | D15 | Yes | 3,230 | 2.092 | 0,000003528165 |
| 1.476 | 2.092 | 2023 | Factory and Quarry | 915.490,000 | t Product manufactured | Industrial grease | 120112 | D15 | Yes | 0,990 | 2.092 | 0,000001081388 |
| 1.477 | 2.092 | 2023 | Factory and Quarry | 915.490,000 | t Product manufactured | Contaminated packaging | 150110 | D13 | Yes | 0,470 | 2.092 | 0,000000513386 |
| 1.478 | 2.092 | 2023 | Factory and Quarry | 915.490,000 | t Product manufactured | WEEE | 200133-200135-160213 | R12 | Yes | 3,878 | 2.092 | 0,000004235983 |
| 1.479 | 2.092 | 2023 | Factory and Quarry | 915.490,000 | t Product manufactured | Empty aerosols | 150111 | R13 | Yes | 0,175 | 2.092 | 0,000000191154 |
| 1.480 | 2.092 | 2023 | Factory and Quarry | 915.490,000 | t Product manufactured | Non-halogenated solvent SK | 140603 | R13 | Yes | 0,330 | 2.092 | 0,000000360463 |
| 1.481 | 2.092 | 2023 | Factory and Quarry | 915.490,000 | t Product manufactured | Used filters | 160107 | R13 | Yes | 0,250 | 2.092 | 0,000000273078 |
| 1.482 | 2.092 | 2023 | Factory and Quarry | 915.490,000 | t Product manufactured | Laboratory reagents | 160506 | R13 | Yes | 0,510 | 2.092 | 0,000000557079 |
| 1.483 | 2.092 | 2023 | Factory and Quarry | 915.490,000 | t Product manufactured | Biohazardous waste | 180103 | D9 | Yes | 0,001 | 2.092 | 0,000000001092 |
| 1.484 | 2.092 | 2023 | Factory and Quarry | 915.490,000 | t Product manufactured | Expired pharmaceutical waste | 070513 | D15 | Yes | 0,011 | 2.092 | 0,000000012015 |
| 1.485 | 2.092 | 2023 | Factory and Quarry | 915.490,000 | t Product manufactured | SK aqueous solution | 120301 | D15 | Yes | 0,900 | 2.092 | 0,000000983080 |
| 1.486 | 2.092 | 2023 | Factory and Quarry | 915.490,000 | t Product manufactured | Fluorescent tubes | 200121 | R12 | Yes | 0,084 | 2.092 | 0,000000091754 |
| 1.487 | 2.092 | 2023 | Factory and Quarry | 915.490,000 | t Product manufactured | Empty gas bottles | 200123 | R12 | Yes | 0,040 | 2.092 | 0,000000043692 |
| 1.488 | 2.092 | 2023 | Factory and Quarry | 915.490,000 | t Product manufactured | End-of-life vehicles | . | . | Yes | 0,000 | 2.092 | 0,000000000000 |
| 1.489 | 2.092 | 2023 | Factory and Quarry | 915.490,000 | t Product manufactured | Others | . | . | Yes | 0,000 | 2.092 | 0,000000000000 |
| 1.815 | 2.092 | 2024 | Factory and Quarry | 808.899,000 | t Product manufactured | Paper and cardboard | 150101 | R12 | No | 12,550 | 2.092 | 0,000015514916 |
| 1.816 | 2.092 | 2024 | Factory and Quarry | 808.899,000 | t Product manufactured | Plastic containers | 150102 | R12 | No | 11,960 | 2.092 | 0,000014785529 |
| 1.817 | 2.092 | 2024 | Factory and Quarry | 808.899,000 | t Product manufactured | Construction and demolition waste | 170904 | R12-R5 | No | 1.266,830 | 2.092 | 0,001566116413 |
| 1.818 | 2.092 | 2024 | Factory and Quarry | 808.899,000 | t Product manufactured | Urban assimilable waste | 200307 | D5 | No | 0,000 | 2.092 | 0,000000000000 |
| 1.819 | 2.092 | 2024 | Factory and Quarry | 808.899,000 | t Product manufactured | Sleeves | 150203 | D5 | No | 0,000 | 2.092 | 0,000000000000 |
| 1.820 | 2.092 | 2024 | Factory and Quarry | 808.899,000 | t Product manufactured | Scrap and metals | 191202 | R12 | No | 354,200 | 2.092 | 0,000437879142 |
| 1.821 | 2.092 | 2024 | Factory and Quarry | 808.899,000 | t Product manufactured | Wood | 170201 | R12 | No | 69,260 | 2.092 | 0,000085622556 |
| 1.822 | 2.092 | 2024 | Factory and Quarry | 808.899,000 | t Product manufactured | Septic tank sludge | 200304 | D8 | No | 45,000 | 2.092 | 0,000055631173 |
| 1.823 | 2.092 | 2024 | Factory and Quarry | 808.899,000 | t Product manufactured | Rubber and plastic waste | 191204 | R12 | No | 59,600 | 2.092 | 0,000073680398 |
| 1.824 | 2.092 | 2024 | Factory and Quarry | 808.899,000 | t Product manufactured | Refractory brick waste | 161106 | R5 | No | 424,020 | 2.092 | 0,000524193997 |
| 1.825 | 2.092 | 2024 | Factory and Quarry | 808.899,000 | t Product manufactured | WEEE: Professional equipment >50 cm ( Hazardous) | 160214 | R12 | No | 1,846 | 2.092 | 0,000002282114 |
| 1.826 | 2.092 | 2024 | Factory and Quarry | 808.899,000 | t Product manufactured | End-of-life tires | 160103 | R13 | No | 0,000 | 2.092 | 0,000000000000 |
| 1.827 | 2.092 | 2024 | Factory and Quarry | 808.899,000 | t Product manufactured | Biodegradable waste (pruning) | 200201 | R12 | No | 38,950 | 2.092 | 0,000048151871 |
| 1.828 | 2.092 | 2024 | Factory and Quarry | 808.899,000 | t Product manufactured | Copper | 170401 | R12 | No | 0,000 | 2.092 | 0,000000000000 |
| 1.829 | 2.092 | 2024 | Factory and Quarry | 808.899,000 | t Product manufactured | Bulky waste | 200307 | R12 | No | 0,000 | 2.092 | 0,000000000000 |
| 1.830 | 2.092 | 2024 | Factory and Quarry | 808.899,000 | t Product manufactured | Others | . | . | No | 0,000 | 2.092 | 0,000000000000 |
| 1.831 | 2.092 | 2024 | Factory and Quarry | 808.899,000 | t Product manufactured | Used oil | 130205 | R12 | Yes | 16,160 | 2.092 | 0,000019977772 |
| 1.832 | 2.092 | 2024 | Factory and Quarry | 808.899,000 | t Product manufactured | Contaminated rags | 150202 | D15 | Yes | 4,440 | 2.092 | 0,000005488942 |
| 1.833 | 2.092 | 2024 | Factory and Quarry | 808.899,000 | t Product manufactured | Industrial grease | 120112 | D15 | Yes | 3,550 | 2.092 | 0,000004388681 |
| 1.834 | 2.092 | 2024 | Factory and Quarry | 808.899,000 | t Product manufactured | Contaminated empty containers | 150110 | D13 | Yes | 1,115 | 2.092 | 0,000001378417 |
| 1.836 | 2.092 | 2024 | Factory and Quarry | 808.899,000 | t Product manufactured | Empty aerosols | 150111 | R13 | Yes | 0,042 | 2.092 | 0,000000051922 |
| 1.837 | 2.092 | 2024 | Factory and Quarry | 808.899,000 | t Product manufactured | Non-halogenated solvent SK | 140603 | R13 | Yes | 0,330 | 2.092 | 0,000000407962 |
| 1.838 | 2.092 | 2024 | Factory and Quarry | 808.899,000 | t Product manufactured | Used filters | 160107 | R13 | Yes | 0,420 | 2.092 | 0,000000519224 |
| 1.839 | 2.092 | 2024 | Factory and Quarry | 808.899,000 | t Product manufactured | Laboratory reagents | 160506 | R13 | Yes | 0,490 | 2.092 | 0,000000605762 |
| 1.840 | 2.092 | 2024 | Factory and Quarry | 808.899,000 | t Product manufactured | Biohazardous waste | 180103 | D9 | Yes | 0,003 | 2.092 | 0,000000003709 |
| 1.841 | 2.092 | 2024 | Factory and Quarry | 808.899,000 | t Product manufactured | Expired pharmaceutical waste | 070513 | D15 | Yes | 0,004 | 2.092 | 0,000000004945 |
| 1.842 | 2.092 | 2024 | Factory and Quarry | 808.899,000 | t Product manufactured | SK aqueous solution | 120301 | D15 | Yes | 1,200 | 2.092 | 0,000001483498 |
| 1.843 | 2.092 | 2024 | Factory and Quarry | 808.899,000 | t Product manufactured | Fluorescent tubes | 200121-200121/31 | R12-R1203 | Yes | 0,038 | 2.092 | 0,000000046977 |
| 1.844 | 2.092 | 2024 | Factory and Quarry | 808.899,000 | t Product manufactured | WEEE: Large appliances containing Hazardous components | February 13, 2016 | R12-R1203 | Yes | 0,066 | 2.092 | 0,000000081592 |
| 1.845 | 2.092 | 2024 | Factory and Quarry | 808.899,000 | t Product manufactured | WEEE Mixed household hazardous waste batteries | 200133 | R12-R1201 | Yes | 0,292 | 2.092 | 0,000000360984 |
| 1.873 | 2.092 | 2024 | Factory and Quarry | 808.899,000 | t Product manufactured | Paper and cardboard packaging | 200101 | R12 | No | 32,905 | 2.092 | 0,000040678750 |
| 1.874 | 2.092 | 2024 | Factory and Quarry | 808.899,000 | t Product manufactured | RAEEs raee equipos <50 cm profesionales no peligrosos | 160214-52 | R12-R1203 | No | 0,723 | 2.092 | 0,000000893808 |
| 1.875 | 2.092 | 2024 | Factory and Quarry | 808.899,000 | t Product manufactured | WEEE (Waste Electrical and Electronic Equipment) – Hazardous household LED lamps | 200136-32 | R12-R1203 | No | 0,015 | 2.092 | 0,000000018544 |
| 1.876 | 2.092 | 2024 | Factory and Quarry | 808.899,000 | t Product manufactured | Plastics | 200139 | R12 | No | 4,480 | 2.092 | 0,000005538392 |
| 1.877 | 2.092 | 2024 | Factory and Quarry | 808.899,000 | t Product manufactured | WEEE Discarded equipment containing CFCs | 200123-200123/12 | R12-R1203 | Yes | 0,256 | 2.092 | 0,000000316480 |
| 1.878 | 2.092 | 2024 | Factory and Quarry | 808.899,000 | t Product manufactured | WEEE Equipment >50 cm domestic with refrigerant gases | 200123-200123/41 | R12-R1203 | Yes | 0,030 | 2.092 | 0,000000037087 |
| 1.879 | 2.092 | 2024 | Factory and Quarry | 808.899,000 | t Product manufactured | WEEE: Hazardous Household IT Equipment | 200135-200135/61 | R12-R1203 | Yes | 0,227 | 2.092 | 0,000000280628 |
| wdt_ID | userid | Year | Center | Units | Description of the waste | CER/LER code. | Hazardous | post_author | ||||
| ∑ = 59,224,943.000 |
 |
Management of raw materials and resources |
Management of material resources
The cement and mortar manufacturing process requires the consumption of large quantities of raw materials. The main raw materials used are extracted from limestone and clay quarries. However, there are also other materials that are essential in smaller quantities to achieve an adequate composition of the intermediate and final products. Most of them are also natural raw materials from other exploitations. In recent years, as part of the strategic policy of Grupo Cementos Portland Valderrivas, the El Alto plant has been committed to replacing natural raw materials with alternative materials in the manufacture of cement and mortar, as a measure to reduce and optimize its operations. These secondary or alternative raw materials come from other industrial processes and are used alongside traditional ones in the production of raw meal, as an additive to cement, or as components of dry mortar. These Recovery practices Recovery a number of environmental benefits, including a reduction in raw material extraction and the amount of waste sent to landfills, without compromising product quality or the safety of workers and the environment. The materials included in each category are: -Natural raw materials used in the production of gray clinker: Limestone, clay, silica sand, and limonite.
-Secondary raw materials used in the production of gray clinker: Hydrocarbon-bearing soils, crushed glass, and fly ash from incinerators.
-Natural raw materials used in the production of white clinker: White limestone, silica-rich kaolin, alumina-rich kaolin, and fluorite.
-Natural raw materials used in cement production: Limestone, clinker, pozzolan, slag, and natural gypsum.
-Secondary raw materials in cement production: Recovered gypsum.
-Natural raw materials in mortar production: Cement, sand, silica, limestone filler, limestone, and additives.
-Secondary raw materials in mortar manufacturing: Fly ash and crushed glass.

Environmental management and control
In 2025, the consumption of natural resources used in the production of white clinker decreased compared to the previous year, while it increased for gray clinker, in line with production levels. An environmental goal has been established to increase the use of secondary raw materials in gray clinker by 2026. However, it is worth noting the difficulty in introducing secondary raw materials due to the scarcity of such materials in the factory’s industrial surroundings and the challenge of ensuring they meet the appropriate specifications for use in the manufacturing process.
Evolution of specific metrics and ratios
Resource consumption
Type of materials
| wdt_ID | userid | Year | Center | Units Pr. | Units | Type of Materials | % Recycled | % Hazardous | Quantity of raw materials (t) | Quantity of Auxiliary Materials. (t) | Quantity Containers & Packs (t) | Total (t) | Total ratio (t)/LU. | Hazardous Materials (t) | Recycled Materials (t) |
|---|---|---|---|---|---|---|---|---|---|---|---|---|---|---|---|
| 236 | 2.092 | 2023 | Quarry | 1.118.095,000 | Limestone and Clay | Blasting explosive | 0,000 | 100,000 | 0,000 | 132,700 | 0 | 132,70 | 0,000119 | 132,70 | 0,00 |
| 240 | 2.092 | 2023 | Factory | 608.011,000 | t Gray Clinker | HC Lands | 100,000 | 0,000 | 0,000 | 4.862,000 | 0 | 4.862,00 | 0,007997 | 0,00 | 4.862,00 |
| 271 | 2.092 | 2023 | Factory | 167.745,000 | t Packaged product | Containers and packaging placed on the market | 0,000 | 0,000 | 0,000 | 0,000 | 1.015 | 1.015,00 | 0,006051 | 0,00 | 0,00 |
| 296 | 2.092 | 2024 | Quarry | 821.090,000 | Limestone and Clay | Blasting explosive | 0,000 | 100,000 | 0,000 | 103,300 | 0 | 103,30 | 0,000126 | 103,30 | 0,00 |
| 301 | 2.092 | 2024 | Factory | 144.845,000 | t Packaged product | Containers and packaging placed on the market | 0,000 | 0,000 | 0,000 | 0,000 | 865 | 865,00 | 0,005972 | 0,00 | 0,00 |
| 834 | 2.092 | 2023 | Factory | 608.011,000 | t Gray Clinker | Limestone for crude oil | 0,000 | 0,000 | 977.435,250 | 0,000 | 0 | 977.435,25 | 1,607595 | 0,00 | 0,00 |
| 835 | 2.092 | 2023 | Factory | 608.011,000 | t Gray Clinker | Clay | 0,000 | 0,000 | 83.720,720 | 0,000 | 0 | 83.720,72 | 0,137696 | 0,00 | 0,00 |
| 836 | 2.092 | 2023 | Factory | 608.011,000 | t Gray Clinker | Natural silica sand | 0,000 | 0,000 | 20.391,970 | 0,000 | 0 | 20.391,97 | 0,033539 | 0,00 | 0,00 |
| 837 | 2.092 | 2023 | Factory | 608.011,000 | t Gray Clinker | Limonite | 0,000 | 0,000 | 28.412,320 | 0,000 | 0 | 28.412,32 | 0,046730 | 0,00 | 0,00 |
| 838 | 2.092 | 2024 | Factory | 472.382,890 | t Gray Clinker | Limestone for crude oil | 0,000 | 0,000 | 712.767,930 | 0,000 | 0 | 712.767,93 | 1,508878 | 0,00 | 0,00 |
| 839 | 2.092 | 2024 | Factory | 472.382,890 | t Gray Clinker | Clay | 0,000 | 0,000 | 73.266,700 | 0,000 | 0 | 73.266,70 | 0,155100 | 0,00 | 0,00 |
| 840 | 2.092 | 2024 | Factory | 472.382,890 | t Gray Clinker | Natural silica sand | 0,000 | 0,000 | 30.903,570 | 0,000 | 0 | 30.903,57 | 0,065421 | 0,00 | 0,00 |
| 841 | 2.092 | 2024 | Factory | 472.382,890 | t Gray Clinker | Limonite | 0,000 | 0,000 | 26.789,660 | 0,000 | 0 | 26.789,66 | 0,056712 | 0,00 | 0,00 |
| 845 | 2.092 | 2024 | Factory | 472.382,890 | t Gray Clinker | HC Lands | 100,000 | 0,000 | 0,000 | 160,040 | 0 | 160,04 | 0,000339 | 0,00 | 160,04 |
| 846 | 2.092 | 2024 | Factory | 472.382,890 | t Gray Clinker | Crushed glass | 100,000 | 0,000 | 0,000 | 678,260 | 0 | 678,26 | 0,001436 | 0,00 | 678,26 |
| 847 | 2.092 | 2024 | Factory | 472.382,890 | t Gray Clinker | Fly ash from an incinerator | 100,000 | 0,000 | 0,000 | 42,120 | 0 | 42,12 | 0,000089 | 0,00 | 42,12 |
| 856 | 2.092 | 2023 | Factory | 665.750,700 | t Gray Cement | Plaster | 0,000 | 0,000 | 697,770 | 0,000 | 0 | 697,77 | 0,001048 | 0,00 | 0,00 |
| 857 | 2.092 | 2023 | Factory | 665.750,700 | t Gray Cement | Ground gypsum (reject gypsum) | 0,000 | 0,000 | 40.548,820 | 0,000 | 0 | 40.548,82 | 0,060907 | 0,00 | 0,00 |
| 858 | 2.092 | 2023 | Factory | 665.750,700 | t Gray Cement | Limestone | 0,000 | 0,000 | 40.144,120 | 0,000 | 0 | 40.144,12 | 0,060299 | 0,00 | 0,00 |
| 859 | 2.092 | 2023 | Factory | 665.750,700 | t Gray Cement | Pozzolana | 0,000 | 0,000 | 18.677,390 | 0,000 | 0 | 18.677,39 | 0,028055 | 0,00 | 0,00 |
| 860 | 2.092 | 2024 | Factory | 565.263,870 | t Gray Cement | Plaster | 0,000 | 0,000 | 6.693,700 | 0,000 | 0 | 6.693,70 | 0,011842 | 0,00 | 0,00 |
| 861 | 2.092 | 2024 | Factory | 565.263,870 | t Gray Cement | Ground gypsum (reject gypsum) | 0,000 | 0,000 | 34.394,130 | 0,000 | 0 | 34.394,13 | 0,060846 | 0,00 | 0,00 |
| 862 | 2.092 | 2024 | Factory | 565.263,870 | t Gray Cement | Limestone | 0,000 | 0,000 | 46.033,380 | 0,000 | 0 | 46.033,38 | 0,081437 | 0,00 | 0,00 |
| 863 | 2.092 | 2024 | Factory | 565.263,870 | t Gray Cement | Pozzolana | 0,000 | 0,000 | 11.490,370 | 0,000 | 0 | 11.490,37 | 0,020327 | 0,00 | 0,00 |
| 871 | 2.092 | 2023 | Factory | 665.750,700 | t Gray Cement | Ferrous sulfate | 100,000 | 0,000 | 186,080 | 0,000 | 0 | 186,08 | 0,000280 | 0,00 | 186,08 |
| 872 | 2.092 | 2023 | Factory | 665.750,700 | t Gray Cement | Slag | 100,000 | 0,000 | 2.640,840 | 0,000 | 0 | 2.640,84 | 0,003967 | 0,00 | 2.640,84 |
| 873 | 2.092 | 2024 | Factory | 565.263,870 | t Gray Cement | Cement grinding additive | 0,000 | 0,000 | 593,560 | 0,000 | 0 | 593,56 | 0,001050 | 0,00 | 0,00 |
| 880 | 2.092 | 2023 | Factory | 141.464,000 | White Clinker | White limestone | 0,000 | 0,000 | 200.102,150 | 0,000 | 0 | 200.102,15 | 1,414509 | 0,00 | 0,00 |
| 881 | 2.092 | 2023 | Factory | 141.464,000 | White Clinker | Kaolin-silica | 0,000 | 0,000 | 27.804,810 | 0,000 | 0 | 27.804,81 | 0,196550 | 0,00 | 0,00 |
| 882 | 2.092 | 2023 | Factory | 141.464,000 | White Clinker | Aluminous kaolin | 0,000 | 0,000 | 16.790,810 | 0,000 | 0 | 16.790,81 | 0,118693 | 0,00 | 0,00 |
| 883 | 2.092 | 2023 | Factory | 141.464,000 | White Clinker | Fluorite | 0,000 | 0,000 | 692,320 | 0,000 | 0 | 692,32 | 0,004894 | 0,00 | 0,00 |
| 884 | 2.092 | 2024 | Factory | 199.677,000 | White Clinker | White limestone | 0,000 | 0,000 | 270.312,200 | 0,000 | 0 | 270.312,20 | 1,353747 | 0,00 | 0,00 |
| 885 | 2.092 | 2024 | Factory | 199.677,000 | White Clinker | Kaolin-silica | 0,000 | 0,000 | 30.015,940 | 0,000 | 0 | 30.015,94 | 0,150322 | 0,00 | 0,00 |
| 886 | 2.092 | 2024 | Factory | 199.677,000 | White Clinker | Aluminous kaolin | 0,000 | 0,000 | 42.810,770 | 0,000 | 0 | 42.810,77 | 0,214400 | 0,00 | 0,00 |
| 887 | 2.092 | 2024 | Factory | 199.677,000 | White Clinker | Fluorite | 0,000 | 0,000 | 2.355,280 | 0,000 | 0 | 2.355,28 | 0,011795 | 0,00 | 0,00 |
| 908 | 2.092 | 2023 | Factory | 43.910,450 | t Manufactured mortar | Gray cement for dry mortar | 0,000 | 0,000 | 4.018,700 | 0,000 | 0 | 4.018,70 | 0,091520 | 0,00 | 0,00 |
| 909 | 2.092 | 2023 | Factory | 43.910,450 | t Manufactured mortar | Sand for dry mortar | 0,000 | 0,000 | 34.299,090 | 0,000 | 0 | 34.299,09 | 0,781115 | 0,00 | 0,00 |
| 910 | 2.092 | 2023 | Factory | 43.910,450 | t Manufactured mortar | Silica for dry mortar | 0,000 | 0,000 | 1.482,960 | 0,000 | 0 | 1.482,96 | 0,033772 | 0,00 | 0,00 |
| 911 | 2.092 | 2023 | Factory | 43.910,450 | t Manufactured mortar | White filler and limestone for dry mortar | 0,000 | 0,000 | 1.071,860 | 0,000 | 0 | 1.071,86 | 0,024410 | 0,00 | 0,00 |
| 912 | 2.092 | 2024 | Factory | 45.380,400 | t Manufactured mortar | Gray cement for dry mortar | 0,000 | 0,000 | 4.478,060 | 0,000 | 0 | 4.478,06 | 0,098678 | 0,00 | 0,00 |
| 913 | 2.092 | 2024 | Factory | 45.380,400 | t Manufactured mortar | Sand for dry mortar | 0,000 | 0,000 | 36.235,750 | 0,000 | 0 | 36.235,75 | 0,798489 | 0,00 | 0,00 |
| 914 | 2.092 | 2024 | Factory | 45.380,400 | t Manufactured mortar | Silica for dry mortar | 0,000 | 0,000 | 2.480,730 | 0,000 | 0 | 2.480,73 | 0,054665 | 0,00 | 0,00 |
| 915 | 2.092 | 2024 | Factory | 45.380,400 | t Manufactured mortar | White filler and limestone for dry mortar | 0,000 | 0,000 | 675,790 | 0,000 | 0 | 675,79 | 0,014892 | 0,00 | 0,00 |
| 916 | 2.092 | 2023 | Factory | 43.910,450 | t Manufactured mortar | Limestone for dry mortar | 0,000 | 0,000 | 2.053,320 | 0,000 | 0 | 2.053,32 | 0,046762 | 0,00 | 0,00 |
| 917 | 2.092 | 2024 | Factory | 45.380,400 | t Manufactured mortar | Limestone for dry mortar | 0,000 | 0,000 | 1.796,940 | 0,000 | 0 | 1.796,94 | 0,039597 | 0,00 | 0,00 |
| 927 | 2.092 | 2023 | Factory | 43.910,450 | t Manufactured mortar | Ash for dry mortar | 100,000 | 0,000 | 390,200 | 0,000 | 0 | 390,20 | 0,008886 | 0,00 | 390,20 |
| 928 | 2.092 | 2023 | Factory | 43.910,450 | t Manufactured mortar | Additives for dry mortar | 0,000 | 0,000 | 15,350 | 0,000 | 0 | 15,35 | 0,000350 | 0,00 | 0,00 |
| 929 | 2.092 | 2024 | Factory | 45.380,400 | t Manufactured mortar | Ash for dry mortar | 100,000 | 0,000 | 635,730 | 0,000 | 0 | 635,73 | 0,014009 | 0,00 | 635,73 |
| 930 | 2.092 | 2024 | Factory | 45.380,400 | t Manufactured mortar | Additives for dry mortar | 0,000 | 0,000 | 13,590 | 0,000 | 0 | 13,59 | 0,000299 | 0,00 | 0,00 |
| wdt_ID | Year | Center | Units | Type of Materials | |||||||||||
| ∑ = 17,408,933.730 |
Relevant aggregated data
| wdt_ID | userid | Year | Center | Units Pr. | Units | Type of Materials | % Recycled | % Hazardous | Quantity of raw materials (t) | Quantity of Auxiliary Materials. (t) | Quantity Containers & Packs (t) | Total (t) | Total ratio (t)/LU. | Hazardous Materials (t) | Recycled Materials (t) |
|---|---|---|---|---|---|---|---|---|---|---|---|---|---|---|---|
| 238 | 2.092 | 2023 | Factory | 608.011,000 | t Gray Clinker | TOTAL NATURAL MMPP IN GREY CLINKER | 0,000 | 0,000 | 1.109.960,260 | 0,000 | 0 | 1.109.960,26 | 1,8255595 | 0,00 | 0,00 |
| 242 | 2.092 | 2023 | Factory | 665.750,700 | t Gray Cement | TOTAL NATURAL MMPP IN GRAY CEMENT | 0,000 | 0,000 | 100.068,100 | 0,000 | 0 | 100.068,10 | 0,1503087 | 0,00 | 0,00 |
| 244 | 2.092 | 2023 | Factory | 665.750,700 | t Gray Cement | TOTAL SECONDARY MMPP IN GRAY CEMENT | 100,000 | 0,000 | 2.826,920 | 0,000 | 0 | 2.826,92 | 0,0042462 | 0,00 | 2.826,92 |
| 246 | 2.092 | 2023 | Factory | 141.464,000 | White Clinker | TOTAL NATURAL MMPP IN WHITE CLINKER | 0,000 | 0,000 | 245.390,090 | 0,000 | 0 | 245.390,09 | 1,7346469 | 0,00 | 0,00 |
| 248 | 2.092 | 2023 | Factory | 141.464,000 | White Clinker | TOTAL SECONDARY MMPP IN WHITE CLINKER | 100,000 | 0,000 | 13.259,570 | 0,000 | 0 | 13.259,57 | 0,0937311 | 0,00 | 13.259,57 |
| 254 | 2.092 | 2023 | Factory | 43.910,450 | t Manufactured mortar | TOTAL NATURAL MMPP IN DRY MORTAR | 0,000 | 0,000 | 42.925,920 | 0,000 | 0 | 42.925,92 | 0,9775787 | 0,00 | 0,00 |
| 256 | 2.092 | 2023 | Factory | 43.910,450 | t Manufactured mortar | TOTAL MMPP FOR SECONDARY EDUCATION IN DRY MORTAR | 96,210 | 0,000 | 405,550 | 0,000 | 0 | 405,55 | 0,0092358 | 0,00 | 390,18 |
| 292 | 2.092 | 2024 | Factory | 199.677,000 | White Clinker | TOTAL NATURAL MMPP IN WHITE CLINKER | 0,000 | 0,000 | 345.494,190 | 0,000 | 0 | 345.494,19 | 1,7302653 | 0,00 | 0,00 |
| 293 | 2.092 | 2024 | Factory | 565.263,870 | t Gray Cement | TOTAL NATURAL MMPP IN GRAY CEMENT | 0,000 | 0,000 | 98.611,580 | 0,000 | 0 | 98.611,58 | 0,1744523 | 0,00 | 0,00 |
| 295 | 2.092 | 2024 | Factory | 45.380,400 | t Manufactured mortar | TOTAL NATURAL MMPP IN DRY MORTAR | 0,000 | 0,000 | 45.667,260 | 0,000 | 0 | 45.667,26 | 1,0063212 | 0,00 | 0,00 |
| 297 | 2.092 | 2024 | Factory | 472.382,890 | t Gray Clinker | TOTAL SECONDARY MMPP IN GREY CLINKER | 100,000 | 0,000 | 0,000 | 880,420 | 0 | 880,42 | 0,0018638 | 0,00 | 880,42 |
| 298 | 2.092 | 2024 | Factory | 565.263,870 | t Gray Cement | TOTAL SECONDARY MMPP IN GRAY CEMENT | 0,000 | 0,000 | 593,560 | 0,000 | 0 | 593,56 | 0,0010501 | 0,00 | 0,00 |
| 299 | 2.092 | 2024 | Factory | 45.380,400 | t Manufactured mortar | TOTAL MMPP FOR SECONDARY EDUCATION IN DRY MORTAR | 97,910 | 0,000 | 649,320 | 0,000 | 0 | 649,32 | 0,0143084 | 0,00 | 635,75 |
| 300 | 2.092 | 2024 | Factory | 199.677,000 | White Clinker | TOTAL SECONDARY MMPP IN WHITE CLINKER | 99,214 | 0,000 | 13.112,460 | 0,000 | 0 | 13.112,46 | 0,0656684 | 0,00 | 13.009,40 |
| 833 | 2.092 | 2025 | Factory | 585.474,180 | t Gray Clinker | TOTAL NATURAL MMPP IN GREY CLINKER | 0,000 | 0,000 | 1.053.921,900 | 0,000 | 0 | 1.053.921,90 | 1,8001168 | 0,00 | 0,00 |
| 842 | 2.092 | 2024 | Factory | 472.382,890 | t Gray Clinker | TOTAL NATURAL MMPP IN GREY CLINKER | 0,000 | 0,000 | 843.727,860 | 0,000 | 0 | 843.727,86 | 1,7861101 | 0,00 | 0,00 |
| 844 | 2.092 | 2023 | Factory | 608.011,000 | t Gray Clinker | TOTAL SECONDARY MMPP IN GREY CLINKER | 100,000 | 0,000 | 0,000 | 4.862,000 | 0 | 4.862,00 | 0,0079966 | 0,00 | 4.862,00 |
| 848 | 2.092 | 2025 | Factory | 585.474,180 | t Gray Clinker | TOTAL SECONDARY MMPP IN GREY CLINKER | 100,000 | 0,000 | 0,000 | 629,360 | 0 | 629,36 | 0,0010750 | 0,00 | 629,36 |
| 851 | 2.092 | 2025 | Factory | 563.320,970 | t Gray Cement | TOTAL NATURAL MMPP IN GRAY CEMENT | 0,000 | 0,000 | 101.725,280 | 0,000 | 0 | 101.725,28 | 0,1805814 | 0,00 | 0,00 |
| 868 | 2.092 | 2025 | Factory | 563.320,970 | t Gray Cement | TOTAL SECONDARY MMPP IN GRAY CEMENT | 0,000 | 0,000 | 601,560 | 0,000 | 0 | 601,56 | 0,0010679 | 0,00 | 0,00 |
| 875 | 2.092 | 2025 | Factory | 160.534,220 | White Clinker | TOTAL NATURAL MMPP IN WHITE CLINKER | 0,000 | 0,000 | 274.167,890 | 0,000 | 0 | 274.167,89 | 1,7078470 | 0,00 | 0,00 |
| 892 | 2.092 | 2025 | Factory | 160.534,220 | White Clinker | TOTAL SECONDARY MMPP IN WHITE CLINKER | 99,208 | 0,000 | 13.091,130 | 0,000 | 0 | 13.091,13 | 0,0815473 | 0,00 | 12.987,45 |
| 895 | 2.092 | 2023 | Factory | 141.464,000 | White Clinker | White plaster | 100,000 | 0,000 | 2.157,410 | 0,000 | 0 | 2.157,41 | 0,0152506 | 0,00 | 2.157,41 |
| 896 | 2.092 | 2023 | Factory | 141.464,000 | White Clinker | Calcite | 100,000 | 0,000 | 11.102,160 | 0,000 | 0 | 11.102,16 | 0,0784805 | 0,00 | 11.102,16 |
| 897 | 2.092 | 2024 | Factory | 199.677,000 | White Clinker | White plaster | 100,000 | 0,000 | 2.363,050 | 0,000 | 0 | 2.363,05 | 0,0118344 | 0,00 | 2.363,05 |
| 898 | 2.092 | 2024 | Factory | 199.677,000 | White Clinker | Calcite | 100,000 | 0,000 | 10.646,340 | 0,000 | 0 | 10.646,34 | 0,0533178 | 0,00 | 10.646,34 |
| 899 | 2.092 | 2024 | Factory | 199.677,000 | White Clinker | Cement grinding additive | 0,000 | 0,000 | 103,070 | 0,000 | 0 | 103,07 | 0,0005162 | 0,00 | 0,00 |
| 903 | 2.092 | 2025 | Factory | 40.194,330 | t Manufactured mortar | TOTAL NATURAL MMPP IN DRY MORTAR | 0,000 | 0,000 | 41.072,593 | 0,000 | 0 | 41.072,59 | 1,0218504 | 0,00 | 0,00 |
| 924 | 2.092 | 2025 | Factory | 40.194,330 | t Manufactured mortar | TOTAL MMPP FOR SECONDARY EDUCATION IN DRY MORTAR | 93,364 | 0,000 | 251,050 | 0,000 | 0 | 251,05 | 0,0062459 | 0,00 | 234,39 |
| wdt_ID | Year | Center | Type of Materials | ||||||||||||
| ∑ = 9,064,687.020 |
 |
Biodiversity |
Biodiversity indicators
The main impact of our activity on the landscape is the exploitation of natural resources in the raw material supply quarries, and the Group has defined as a future challenge the "development of integrated management criteria for the restoration of quarries and the promotion of biodiversity". In this sense, the Environmental Monitoring Program establishes the approach and the work to be carried out in such a way that the areas outside the quarry are not affected. The restoration forecast for fiscal year 2025 was very ambitious, largely due to the uncertainty surrounding the materials we might encounter while mining the second level of limestone, which, given their characteristics, might force us to move the mining fronts forward. Since mining operations on the second level of the limestone formation continue to be fully satisfactory, the pace of restoration has been slower than anticipated, as mining on the second level is delaying the release of the final quarry area ready for restoration. During 2025, restoration work was carried out on 1.5 ha of the quarry area north of the “Concha I” face, continuing the work begun in 2024. Work continued on shaping the slope by spreading topsoil evenly across the entire area to be restored, and finally, the site was revegetated. In addition, most of the exposed quarry surface has been restored. The terrain has been graded to eliminate all steep slopes and give the surface a gentle, natural gradient. Topsoil has been brought in and spread, and the planting of shrub species was completed in the final stretch of 2025. A total of 7.67 ha has reached the final restoration phase.
| wdt_ID | userid | post_author | Year | Center | Units Pr. | Units | Total land use (m2) | Sealed surface area (m²) | Unsealed area (m2) | Land use / nature | Area oriented according to nature at the site (m²) | Non-central area oriented according to nature (m²) | Usage ratio (m2)/Udp. | Sealed ratio (m2)/Udp. | Unsealed Ratio (m2/Udp) | Targeted ratio (m2)/Udp. | Off-center ratio (m2)/Udp. |
|---|---|---|---|---|---|---|---|---|---|---|---|---|---|---|---|---|---|
| 105 | 2.092 | 2.092 | 2023 | Factory and Quarry | 820.860,000 | t Product manufactured | 5.996.300 | 268.903 | 5.537.397 | 190.000 | 7,3049 | 0,3276 | 6,7458 | 0,2315 | 0,0000 | ||
| 112 | 2.092 | 2.092 | 2024 | Factory and Quarry | 808.899,000 | t Product manufactured | 5.996.300 | 268.903 | 5.537.397 | 190.000 | 7,4129 | 0,3324 | 6,8456 | 0,2349 | 0,0000 | ||
| Year | Center | ||||||||||||||||
| ∑ = 1,629,759.000 |
 |
Other information of environmental interest |
Indicators and impacts
The progress in environmental performance at the El Alto plant is tracked—as at the rest of Grupo Cementos Portland Valderrivas plants—by measuring a series of basic environmental performance and management indicators, as no sector-specific reference documents or activity-type-specific indicators have been published to date; these will be adopted upon their future publication in accordance with the new EMAS III Regulation.

Significant and/or sector specific indicators
Sound emissions
Noise emissions in the vicinity of manufacturing facilities can potentially cause disturbances to the local population and wildlife. The El Alto factory is located in a rural setting, in an area far from urban centers and surrounded primarily by agricultural land.
An annual measurement campaign is conducted at representative points in the quarry to ensure compliance with established legal requirements. A biennial self-monitoring campaign is carried out at the plant. In 2025, the results of the measurements at the plant and quarry meet the reference values at all points.
| wdt_ID | userid | Year | Center | Units | Units Pr. | Indicator description | Origin / Type / Appearance | Value | Unit of value | Information | post_author | Pr. Ratio |
|---|---|---|---|---|---|---|---|---|---|---|---|---|
| 237 | 2.092 | 2023 | Quarry | Maximum value found | Noise Emissions Quarry | 63,300 | Decibels (dBA) | Annual acoustic study report on the Morata Valderrivas quarry. Límite 65. |
2.092 | 0,000000 | ||
| 238 | 2.092 | 2024 | Quarry | Maximum value found | Noise Emissions Quarry | 61,400 | Decibels (dBA) | Annual acoustic study report on the Morata Valderrivas quarry. Límite 65. |
2.092 | 0,000000 | ||
| 540 | 2.092 | 2025 | Quarry | Maximum value found | Noise Emissions Quarry | 55,900 | Decibels (dBA) | Annual acoustic study report on the Morata Valderrivas quarry. Límite 65. |
2.092 | 0,000000 | ||
| wdt_ID | userid | Year | Center | Units | Origin / Type / Appearance | post_author | ||||||
| ∑ = 0,000 |
 |
Environmental aspects and impacts |
Environmental aspects and impacts
The identification of environmental aspects is based on an analysis of the processes, facilities and products of the factory and quarry with a life cycle approach of the manufactured products. This identification, objective and quantitative, takes into account possible interactions with the environment - soil, water, atmosphere, natural environment, socio-economic environment, population, etc. - as well as normal and abnormal operating and functioning conditions, potential accidental or emergency situations, indirectly generated aspects and those that may derive from past activities, aware of the importance of adopting preventive measures at the source of our actions.

Description of the most important and significant environmental aspects
The identification of environmental aspects is based on an analysis of the processes, facilities and products of the factory and quarry with a life cycle approach of the manufactured products. This identification, objective and quantitative, takes into account possible interactions with the environment - soil, water, atmosphere, natural environment, socio-economic environment, population, etc. - as well as normal and abnormal operating and functioning conditions, potential accidental or emergency situations, indirectly generated aspects and those that may derive from past activities, aware of the importance of adopting preventive measures at the source of our actions.
Description of the Most Notable and Significant Environmental Aspects
The evaluation of environmental aspects is a starting point for the revision of the System and for the definition and updating of operational control procedures, and those for action in the event of potential accidents and emergency situations. The evaluation carried out annually on environmental aspects, in general, is established on the basis of a series of definitive environmental criteria as indicated.
- Hazard or level of environmental impact of the aspect.
- Quantity or volume of the environmental aspect.
- Complaints received from stakeholders and legal non-compliance.
- Severity or level of severity of the impact, generally associated with the intrinsic and objective hazard.
- Probability, frequency or recurrence with which the aspect occurs.
- Capacity to influence economic, technical or human resources to carry out actions for prevention, control and correction of the aspect.
Based on the evaluation carried out, the significant environmental aspects with the greatest impact are determined and which, therefore, have a score higher than that established as significant, in accordance with the criteria indicated. Based on these, the activity plans its operational control and improvement objectives.
Direct environmental aspects are those generated as a result of the activities of the factory and quarry over which there is full control of their management. Grouped according to their environmental vector, the following environmental aspects have been identified and evaluated under normal and abnormal conditions.
Indirect environmental aspects are those aspects derived from the factory's activities, products and services over which there is no full control of their management. The following have been identified and evaluated as environmental aspects to be taken into account:
Greenhouse gas emissions as a result of the transportation of purchased products.
Greenhouse gas emissions from electricity consumption.
Packaging waste placed on the market once it has been used.
The assessment is based on the following environmental criteria: quantity—compared to the previous year—and potential for impact—based on the possibility of implementing measures to reduce it—and no indirect environmental aspects were identified as significant.
|
ASPECT |
IMPACT |
|
Confined and diffuse atmospheric emissions |
Acid rain Photochemical smog, effects on fauna and flora and nuisance to the population |
|
CO2emissions |
Global warming |
|
Power consumption |
Depletion of natural resources |
|
Water consumption |
Depletion of natural resources |
|
Fuel consumption, raw materials and additives |
Natural resource depletion and global warming |
|
Consumption of auxiliary materials |
Depletion of natural resources |
|
Waste generation |
Use of natural resources and land occupation |
|
Sound emission |
Disturbance to the population and wildlife |
|
Water discharges |
Deterioration in water quality |
|
Exploitation of natural resources |
Deterioration of the landscape and increase in visual impact |
|
Land occupation |
Landscape disturbance and soil and groundwater contamination |
|
ASPECTS ABNORMAL CONDITIONS |
IMPACT |
|
Atmospheric emissions from furnaces and other sources |
Acid rain Photochemical smog and effects on fauna and flora and inconvenience to the public |
|
Unconfined atmospheric emissions |
Impact on fauna and flora and nuisance to the population |
|
Fugitive emissions of fluorinated gases into the atmosphere |
Greenhouse effect and ozone layer depletion |
Description of significant environmental aspects
| wdt_ID | state | userid | Year | Center | Life Cycle Phase | Environmental Aspect | Impact | Typology | Process | udimpact | Actions | Analysis | Significant | ID | post_author |
|---|---|---|---|---|---|---|---|---|---|---|---|---|---|---|---|
| 1.147 | VALIDATED | 2.092 | 2023 | Factory | MANUFACTURING | NOx furnace 7 and 6 | AIR POLLUTION | Direct | Production | 10 | Yes | 138.973 | 2.092 | ||
| 1.148 | VALIDATED | 2.092 | 2023 | Factory | MANUFACTURING | White CO2 (kg CO2/ t ck) | CLIMATE CHANGE | Direct | Production | 15 | Yes | 138.973 | 2.092 | ||
| 1.149 | VALIDATED | 2.092 | 2023 | Factory | MANUFACTURING | White thermal consumption (MJ/ t ck) | RESOURCE DEPLETION | Direct | Production | 15 | Yes | 138.973 | 2.092 | ||
| 1.150 | VALIDATED | 2.092 | 2023 | Factory | MANUFACTURING | Safety Kleen aqueous solution generation | WASTE GENERATION Hazardous | Direct | Production | 15 | Yes | 138.973 | 2.092 | ||
| 1.151 | VALIDATED | 2.092 | 2023 | Factory | MANUFACTURING | Generation of contaminated rags | WASTE GENERATION Hazardous | Direct | Production | 15 | Yes | 138.973 | 2.092 | ||
| 1.152 | VALIDATED | 2.092 | 2023 | Factory | MMPP SUPPLY | QUARRY noise emission (maximum immission value dBA) | SENSORY/ATMOSPHERIC IMPACTS | Direct | Extraction | 25 | Yes | 138.973 | 2.092 | ||
| 1.153 | VALIDATED | 2.092 | 2023 | Factory | MANUFACTURING | White PST | AIR POLLUTION | Abnormal / Indirect | Production | 10 | Yes | 138.973 | 2.092 | ||
| 1.253 | VALIDATED | 2.092 | 2024 | Factory | MANUFACTURING | CO2 emission WHITE (kg CO2/ t ck) | CLIMATE CHANGE | Direct | Production | 15 | Yes | 138.973 | 2.092 | ||
| 1.254 | VALIDATED | 2.092 | 2024 | Factory | MANUFACTURING | Thermal consumption WHITE (MJ/ t ck) | RESOURCE DEPLETION | Direct | Production | 15 | Yes | 138.973 | 2.092 | ||
| 1.255 | VALIDATED | 2.092 | 2024 | Factory | MANUFACTURING | Thermal consumption GRAY | RESOURCE DEPLETION | Direct | Production | 15 | Yes | 138.973 | 2.092 | ||
| 1.256 | VALIDATED | 2.092 | 2024 | Quarry | MMPP SUPPLY | Diffuse atmospheric emissions at CANTERA | SENSORY/ATMOSPHERIC IMPACTS | Direct | Extraction | 25 | Yes | 138.973 | 2.092 | ||
| 1.257 | VALIDATED | 2.092 | 2024 | Factory | MANUFACTURING | Gray cement material substitution rate (t mat/ cem produced) | RESOURCE DEPLETION | Direct | Production | 15 | Yes | 138.973 | 2.092 | ||
| 1.258 | VALIDATED | 2.092 | 2024 | Factory | MANUFACTURING | Septic tank sludge generation | SOIL DISTURBANCE, WASTE TREATMENT | Direct | Production | 15 | Yes | 138.973 | 2.092 | ||
 |
Environmental improvement planning |
Target Planning
The environmental program is the tool used to minimize environmental impacts as much as possible, starting with the significant ones. It is developed based on the basic principles established in the Environmental and Energy Policy and is updated annually. In our planning, we take into account the results of the assessment of aspects, risks, and opportunities; legal requirements; nonconformities and incidents that have occurred; the opinions of stakeholders; and technological options for implementing opportunities for improvement.
The environmental objectives for 2025 are also defined, taking into account the objectives from the previous year (2024).

Environmental improvement planning
This table shows the results of the Environmental Program implemented during the 2024–2025 period in terms of the achievement of its objectives and targets. Progress toward these goals was monitored through meetings of the plant-level Environmental Committees and the Environmental Committees of the Spain Operations Division, which were held at the corporate level.
The following are the planned improvement objectives (2024 - 2025)
| userid | wdt_ID | Year | Center | Life Cycle Phase | Objective | Goal / Action | Impact/Associated Impact | Target Value | Value reached | % Achieved | Department / Resource | Deadline | Remarks | post_author |
|---|---|---|---|---|---|---|---|---|---|---|---|---|---|---|
| userid | wdt_ID | Year | Center | Life Cycle Phase | Impact/Associated Impact | post_author |
 |
Legal compliance analysis |
Legal and regulatory compliance
The organization has a procedure and system for the identification of legal requirements, as well as for periodic evaluation to ensure full compliance. The following is a list of current environmental permits and/or authorizations, as well as a summary of their validity.
The organization has a procedure and system for the identification of legal requirements, as well as for periodic evaluation to ensure full compliance. The following is a list of current environmental permits and/or authorizations, as well as a summary of their validity.
The activities carried out by the El Alto plant are carried out in accordance with the applicable European, national, regional and local environmental regulations in force, as well as the specific requirements of each facility. The evaluation of legal compliance is carried out on a periodic and procedural basis, requirement by applicable requirement.

List of permits, authorizations and declarations in force
The Integrated Environmental Permit is a permit issued by the Government of the Community of Madrid that sets forth the technical requirements and the monitoring regime to be followed for most environmental aspects. The Integrated Environmental Permit is a permit issued by the Government of the Community of Madrid that sets forth the technical requirements and the monitoring regime to be followed for most environmental aspects. The most relevant resolutions are listed below.
Resolution of the Environmental Directorate of the Community of Madrid, dated November 14, 2017, issuing the revision of the Integrated Environmental Authorization granted to the gray and white cement and dry mortar manufacturing facility at the El Alto facilities in the municipality of Morata de Tajuña (Madrid).
Response dated September 17, 2018, from the General Directorate of the Environment to the environmental report on a non-substantial modification, authorizing an increase in the maximum annual percentage of energy that may come from alternative fuels.
Resolution dated May 28, 2019, from the General Directorate of Environment and Sustainability amending the AAI.
Communication dated September 12, 2019, from the General Directorate of Sustainability and Climate Change regarding the current environmental conditions of the AAI.
Resolution of the General Directorate of Energy Transition and Circular Economy of the Community of Madrid amending the AAI, dated September 16, 2025, which automatically incorporates into the AAI all non-substantial amendments made since 2019.
- Resolution of July 21, 2021 of the General Directorate for Decarbonization and Energy Transition of Greenhouse Gas Emission Authorization.
- Resolution of the C.H. del Tajo of 25-07-2003 of Concession of water for industrial uses in T.M. Morata de Tajuña.
- Resolution of March 16, 2015, issued by the Regional Ministry of Economy and Finance, granting administrative authorization to the quarry pursuant to Law 34/2007.
- Resolution of March 23, 2015 amendment of the Department of the Ministry of Economy and Finance approving the Plan for the Restoration of Natural Spaces in the Morata-Valderrivas quarry exploitation.
- Resolutions of March 23, 2015, issued by the Regional Ministry of Economy and Finance, granting a 30-year extension for the “Morata 2752-011” and “Morata-Valderrivas 2809-011” mining concessions for Section C resources.
The Integrated Environmental Authorization is a permit, granted by the regional government, which sets out the controls to be carried out and the legal limits to be complied with in most environmental aspects.
Regulatory Compliance Summary
In addition to the provisions regarding the AAI and GHG Emission Authorization, the most significant legislative changes introduced in 2025 and incorporated into the requirements governing the manufacture of cement and mortar and the operation of quarries are as follows:
- COMMISSION IMPLEMENTING REGULATION (EU) 2025/486 of March 17, 2025. laying down detailed rules for the implementation of Regulation (EU) 2023/956 of the European Parliament and of the Council as regards the requirements and procedures relating to the status of authorized declarant for the purposes of the Carbon Border Adjustment Mechanism (CBAM)
- COMMISSION IMPLEMENTING REGULATION (EU) 2025/2620 of December 16, 2025 Calculation of the adjustment to the free allocation based on the number of MAFC allowances to be surrendered.
- COMMISSION IMPLEMENTING REGULATION (EU) 2025/2547 of December 10, 2025. Methods for Calculating Emissions Implicit in Goods
- COMMISSION IMPLEMENTING REGULATION (EU) 2025/772 of April 16, 2025, amending and correcting Implementing Regulation (EU) 2019/1842 laying down provisions for the implementation of Directive 2003/87/EC of the European Parliament and of the Council with regard to additional provisions for adjusting the free allocation of emission allowances due to changes in the level of activity
- Royal Decree 214/2025, of March 18, creating the registry of carbon footprint, offsetting and carbon dioxide absorption projects and establishing the obligation to calculate the carbon footprint and the preparation and publication of greenhouse gas emission reduction plans.
An evaluation of environmental legal compliance is carried out periodically with the participation of the Legal Department, with satisfactory results.
During fiscal year 2025, the various activities were carried out in accordance with current environmental regulations, as well as all specific requirements applicable to each activity.
No legal or other claims have been received that have involved or could entail other legal or financial liabilities. In 2025, following a thorough review and analysis, the El Alto Plant of Grupo Cementos Portland Valderrivas concluded that all applicable environmental legal requirements have been met.
Statement of compliance with legislation
"We hereby declare, on the part of our organization, compliance with environmental legislation and permit conditions during the period indicated and at the sites included in this Environmental Statement."
|
Good environmental management practices |
Ecodesign and life cycle analysis
Life Cycle Assessment (LCA) of a product, process or technology is a methodology that attempts to identify, quantify and characterize the different potential environmental impacts associated with each stage of a product's life cycle. The LCA provides valuable information that allows the industry and users to make decisions aimed at improving the environmental performance of processes and products.
Reinforcing its commitment to the sustainability of its products, Cementos Portland Valderrivas has begun the certification process for the “sustainable” N mark—or Ns mark—for all its cements. This mark is an evolution of AENOR’s traditional N quality mark and represents a new sustainability certification standard for industrial and construction products.
The Ns mark is the first certification in Spain that guarantees that a product is sustainable from an integral approach, evaluating technical and performance quality, environmental impact, social responsibility and corporate governance.
The Santa Margarida i Els Monjos plant in Barcelona was the Group’s first to obtain this certification in late 2024, paving the way for the rest of the plants to earn this distinction in 2025.
The cement sector, as a sector sensitive to sustainable development, has developed a life cycle analysis through AENOR's Global EPD Program, which has resulted in sectoral environmental product declarations (EPD).
Thus, the cement industry evaluates its impact, manages the use of different types of waste as raw materials or fuels, controls the destination of packaging, and monitors its process in search of the best environmental performance.
In order to promote transparency, the company has decided to draft and verify the Environmental Product Declarations for the cements it sells at all of its plants in Spain. This work, carried out during 2024, culminated in the validation and publication of the 8 cements produced at the El Alto plant.
The GlobalEPD Declarations have been issued in accordance with the GlobalEPD-RCP-003 Cement Rules and in accordance with UNE-EN 16908:2019+A1:2022. All environmental declarations are in accordance with European Standard EN 15804.
ENVIRONMENTAL PRODUCT DECLARATIONS
Best practices in environmental management
Best Environmental Management Practices
◉ Verification record
This Digital Environmental Statement has been verified by:
– AENOR
The document with the highest validity—or in the event of discrepancies—shall be the PDF digitally signed by the verifying body. This document is an accurate representation and printout of this Digital Environmental Declaration or rendered web page. Interested parties may download this rendered version here as a sample and proof of the immutability and consistency of the data validated in this DIGITAL ENVIRONMENTAL DECLARATION. DAD-EMAS-2025-EL-ALTO.pdf
Verifier’s Statement: Certificate VDM-06-042_ES_2025-08-22
Date of lastupdate: – Render version File No.: 0
ORGANIZATION: GRUPO CEMENTOS PORTLAND VALDERRIVAS - CENTER/s - COVERAGE: FACTORY EL ALTO MORATA DE TAJUÑA
ACCESS TO THE EUROPEAN REGISTRY: EUROPEAN COMMISSION
TRANSLATIONS OF THIS ENVIRONMENTAL STATEMENT: This EMAS Environmental Statement has been verified in its original language. The browsers used by stakeholders for consultation, or the Platform RightSupply itself, may automatically translate its direct transcription, without the certifying body considering its translated content as validated a priori. Methods such as sworn translation are recommended for this purpose.
EXTERNAL LINKS AND AUDIOVISUAL CONTENT: This EMAS Environmental Statement has been verified in its entirety, with the exception of external links and audiovisual or videographic content that may have been included for complementary purposes.
DIGITALIZATION: Digitization of environmental statements is a best practice with multiple sustainability benefits. By eliminating the use of paper, a significant reduction in energy and water consumption is achieved, which in turn minimizes the carbon footprint. This digital transition not only supports the environment, but also improves data accuracy and consistency, optimizing management efficiency, environmental reporting and access to information for stakeholders. This initiative was recognized as a best practice in 2022 within the European Union's INTERREG EUROPE public policy program (ENHANCE EMAS), underlining its importance in promoting a greener and more efficient administration across Europe.
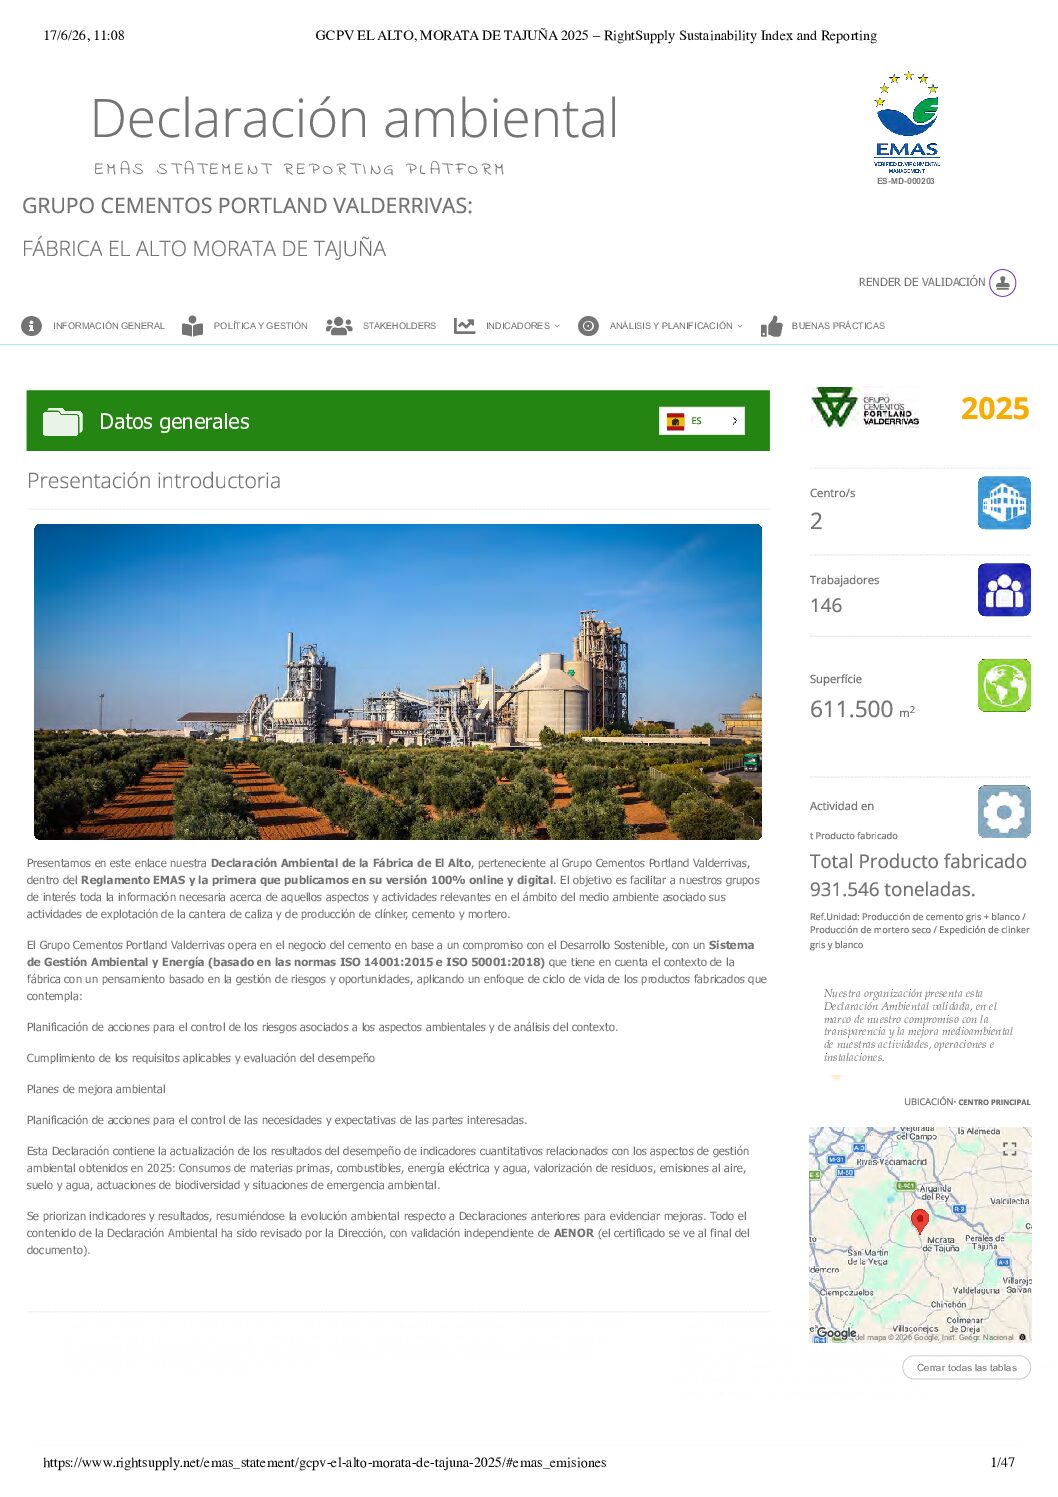
CO₂ eq: stands for carbon dioxide equivalent. It is used to measure the impact of different greenhouse gases on global warming by converting emissions of these gases into the equivalent amount of carbon dioxide (CO₂) that would produce the same effect.
EMAS: Eco-Management and Audit Scheme (EMAS). It is a voluntary environmental management system developed by the European Union for organizations that wish to assess, manage, and improve their environmental performance.
GJ: Unit of energy. A gigajoule is a unit of energy measurement, equivalent to one billion joules (J).
LPG: Liquefied Petroleum Gas. It is a mixture of gaseous hydrocarbons, primarily propane and butane, which are liquefied to facilitate their storage and transport.
GN: Natural Gas.
ISO: International Organization for Standardization. It is an organization that develops international standards for various products, services, and management systems.
kt: Unit of mass equal to 1,000 metric tons.
MWh: A unit of energy equal to one megawatt-hour.
NACE: A standard used to classify the various economic activities carried out in the EU, facilitating the comparison of data across countries and the compilation of standardized statistics.
PPA: Power Purchase Agreement. This is a long-term contract between an energy buyer and a renewable energy producer that establishes the terms for the sale and purchase of electricity.
S1: Scope 1 for CO2eq emissions.
S2: Scope 2 for CO2eq emissions.
S3: Scope 3 for CO2eq emissions.
Units: Unit. Units .: Concentration unit.
Units : Production unit.
UNE: stands for the Spanish Association for Standardization. It is the entity responsible for developing technical standards in Spain, acting as the national standardization body. UNE promotes quality, safety, and efficiency in products and services through the development and dissemination of standards.
∑ (uppercase sigma): used in mathematics to represent the sum of a series of terms.
Template: 2026 Final